

Question: The null hypothesis for the goodness-of-fit test is that 40% of all elements of the population belong to the first category, 30% belong to the
The null hypothesis for the goodness-of-fit test is that 40% of all elements of the population belong to the first category, 30% belong to the second category, 20% belong to the third category, and 10% belong to the fourth category.
What is the expected frequency for the fourth category?
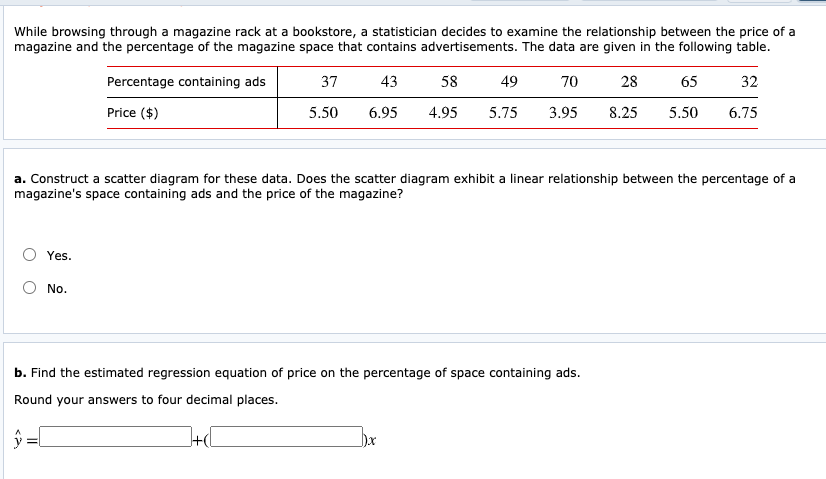
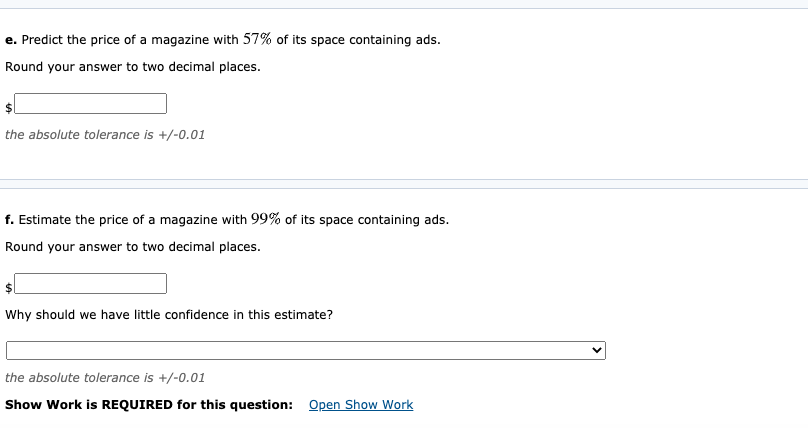
While browsing through a magazine rack at a bookstore, a statistician decides to examine the relationship between the price of a magazine and the percentage of the magazine space that contains advertisements. The data are given in the following table. Percentage containing ads 37 43 58 49 70 28 65 32 Price ($) 5.50 6.95 4.95 5.75 3.95 8.25 5.50 6.75 a. Construct a scatter diagram for these data. Does the scatter diagram exhibit a linear relationship between the percentage of a magazine's space containing ads and the price of the magazine? Yes. O No. b. Find the estimated regression equation of price on the percentage of space containing ads. Round your answers to four decimal places.e. Predict the price of a magazine with 57% of its space containing ads. Round your answer to two decimal places. the absolute tolerance is +/-0.01 f. Estimate the price of a magazine with 99% of its space containing ads. Round your answer to two decimal places. Why should we have little confidence in this estimate? the absolute tolerance is +/-0.01 Show Work is REQUIRED for this question: Open Show Work
Step by Step Solution
There are 3 Steps involved in it

Get step-by-step solutions from verified subject matter experts