

Question: The null hypothesis would be?The alternate hypotheses would be?The variable blood type is measure at the ____ level of measurement?The variable bloody type is a
The null hypothesis would be?The alternate hypotheses would be?The variable blood type is measure at the ____ level of measurement?The variable bloody type is a _______ variable ?The value for the x^2 statistic is?The p value is?Will we reject the null hypothesis ?Will we conclude that a relationship exists between KIN 200 students and blood type?We conclude from this problem that?The type of statistical errors we could have made in this problem is?
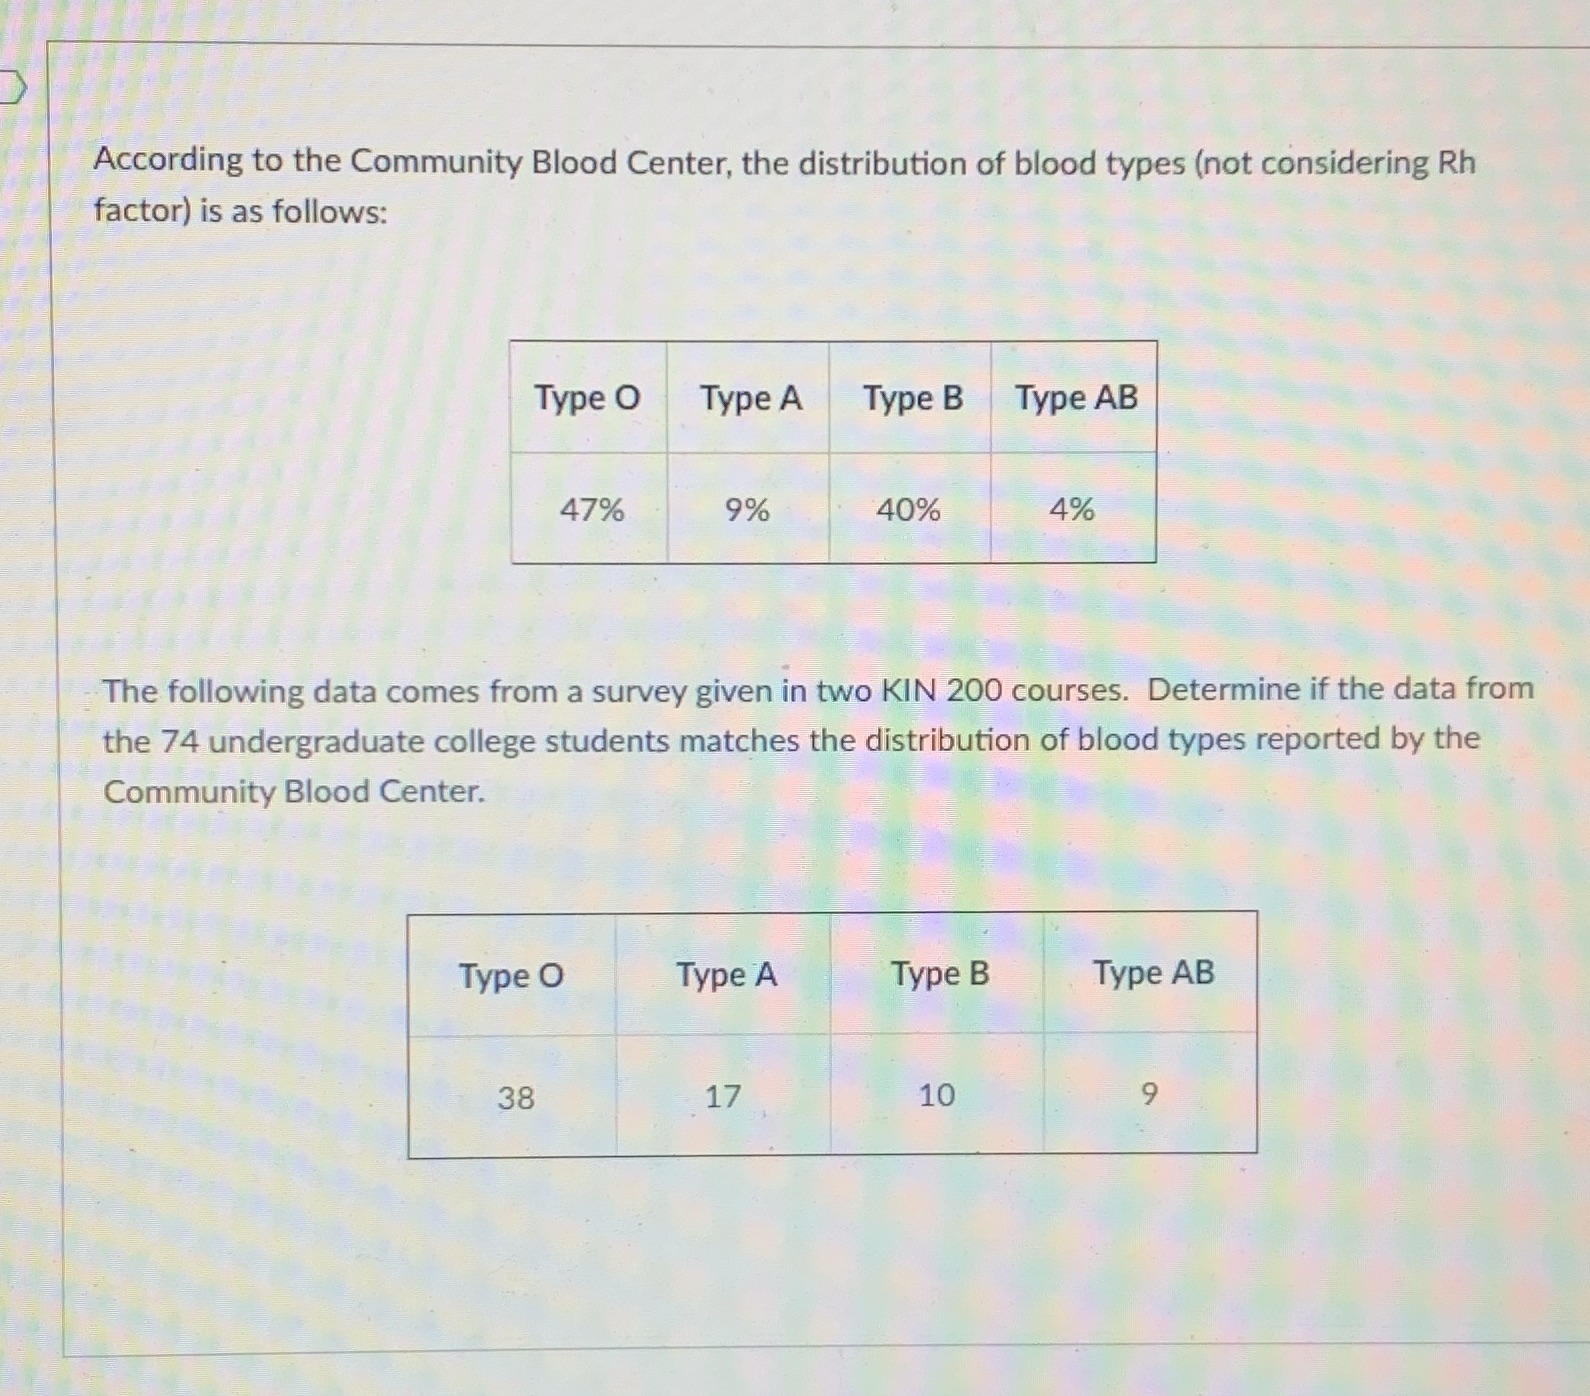
According to the Community Blood Center, the distribution of blood types (not considering Rh factor) is as follows: Type O Type A Type B Type AB 47% 9% 40% 4% The following data comes from a survey given in two KIN 200 courses. Determine if the data from the 74 undergraduate college students matches the distribution of blood types reported by the Community Blood Center. Type O Type A Type B Type AB 38 17 10
Step by Step Solution
There are 3 Steps involved in it

Get step-by-step solutions from verified subject matter experts