

Question: The ogives shown are based on U.S. Census data and show the average annual personal Income per capita for each of the 50 states, The
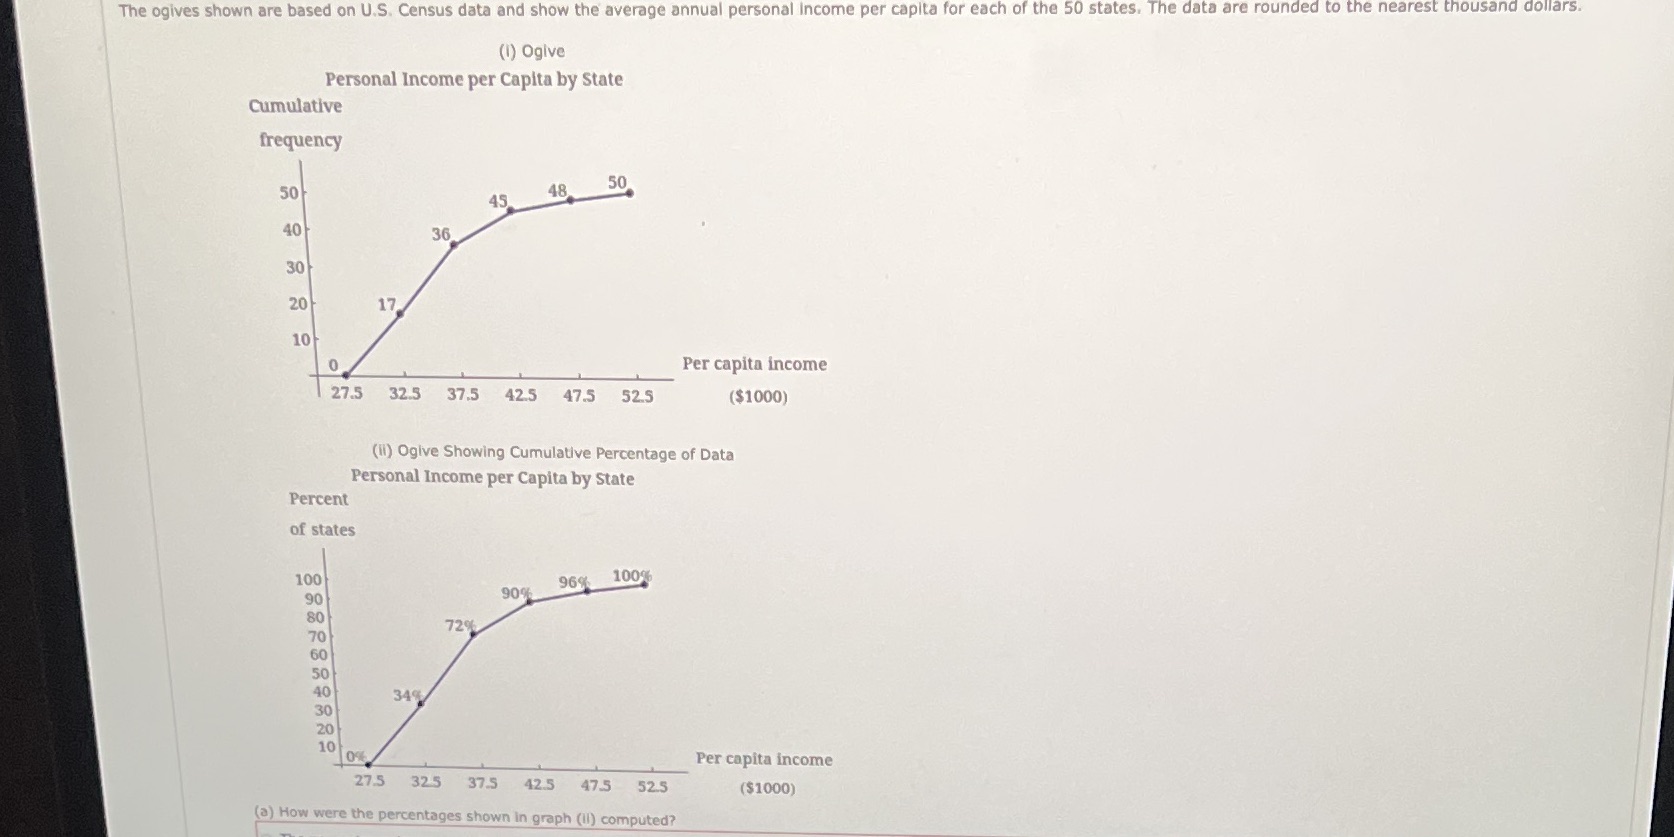
The ogives shown are based on U.S. Census data and show the average annual personal Income per capita for each of the 50 states, The data are rounded to the nearest thousand dollars. (1) Ogive Personal Income per Capita by State Cumulative frequency 48 50 50 45 40 36 30 20 17 10 0 Per capita income 27.5 32.5 37.5 42.5 47.5 52.5 ($1000) (il) Ogive Showing Cumulative Percentage of Data Personal Income per Capita by State Percent of states 100 96% 90 90% 80 72% 70 60 50 40 34 30 20 10 Per capita income 27.5 325 37.5 42.5 475 52.5 ($1000) (a) How were the percentages shown in graph (II) computed
Step by Step Solution
There are 3 Steps involved in it
1 Expert Approved Answer
Step: 1 Unlock

Question Has Been Solved by an Expert!
Get step-by-step solutions from verified subject matter experts
Step: 2 Unlock
Step: 3 Unlock