

Question: The options are: Line chart, bar chart, pie chart, Bubble chart, scatter chart, histogram Match the correct graph/chart to each of the following descriptions (you
 The options are: Line chart, bar chart, pie chart, Bubble chart, scatter chart, histogram
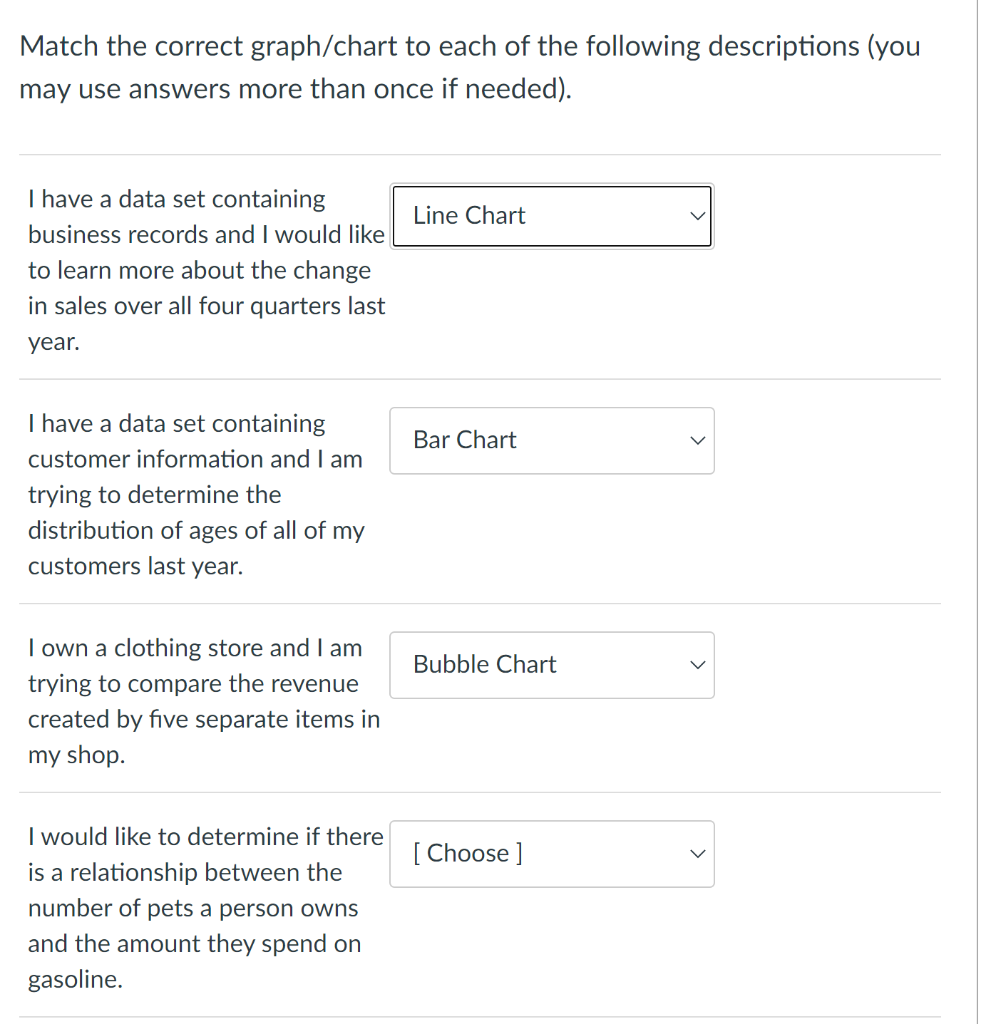
Match the correct graph/chart to each of the following descriptions (you may use answers more than once if needed). Line Chart I have a data set containing business records and I would like | to learn more about the change in sales over all four quarters last year. Bar Chart I have a data set containing customer information and I am trying to determine the distribution of ages of all of my customers last year. Bubble Chart I own a clothing store and I am trying to compare the revenue created by five separate items in my shop. [ Choose ] I would like to determine if there is a relationship between the number of pets a person owns and the amount they spend on gasoline. [ Choose ] I am trying to show what percentage of the engineering students at Boulder are currently enrolled in each engineering department (mechanical, electrical, etc.)
Step by Step Solution
There are 3 Steps involved in it

Get step-by-step solutions from verified subject matter experts