

Question: The output below is generated from regressing FORD's excess returns on market's excess returns (S&P 500). Estimate SE t Stat p-value Intercept -0.0098 0.0077 1.2767
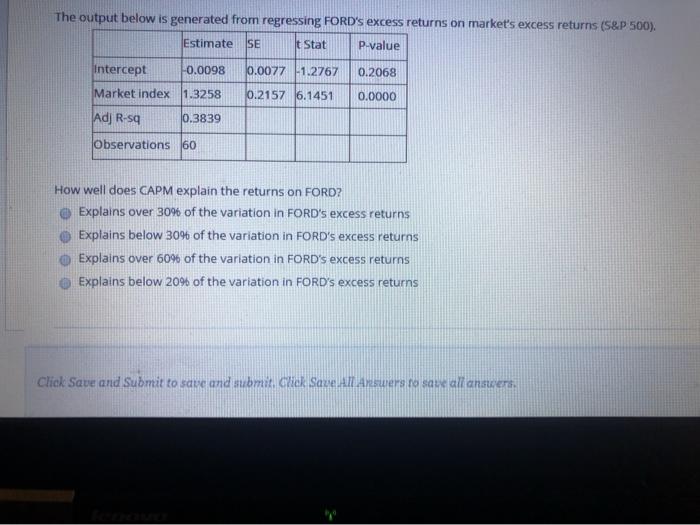
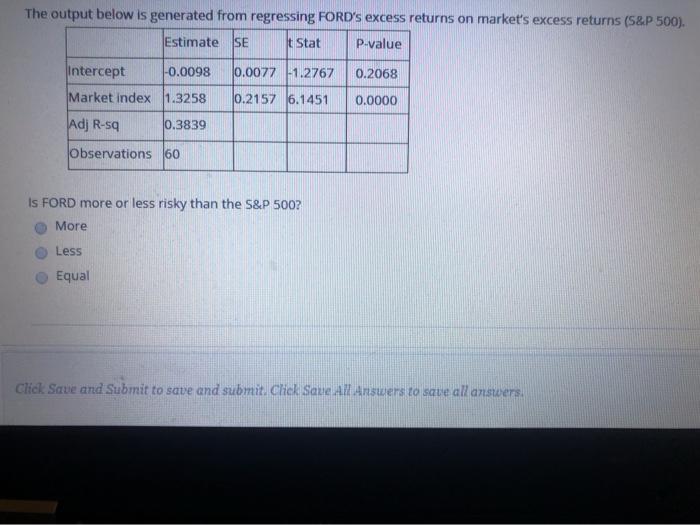
The output below is generated from regressing FORD's excess returns on market's excess returns (S&P 500). Estimate SE t Stat p-value Intercept -0.0098 0.0077 1.2767 0.2068 Market Index 1.3258 0.2157 6.1451 0.0000 Adj R-sq 0.3839 Observations 60 How well does CAPM explain the returns on FORD? Explains over 30% of the variation in FORD's excess returns Explains below 30% of the variation in FORD's excess returns Explains over 60% of the variation in FORD's excess returns Explains below 20% of the variation in FORD's excess returns Click Save and Submit to save and submit Chick Save All Answers to save all answers, The output below is generated from regressing FORD's excess returns on market's excess returns (5&P 500). Estimate SE t Stat P-value 0.0077 1.2767 0.2068 Intercept -0.0098 Market index 1.3258 0.2157 6.1451 0.0000 Adj R-sa 0.3839 Observations 60 Is FORD more or less risky than the S&P 500? More Less Equal Click Save and Submit to save and submit Chek Saue Ad Answers to save all answers
Step by Step Solution
There are 3 Steps involved in it

Get step-by-step solutions from verified subject matter experts