

Question: The overall average on a process you are attempting to monitor is 75 units. The process standard deviation is 1.75. Determine the upper and lower
The overall average on a process you are attempting to monitor is 75 units. The process standard deviation is 1.75. Determine the upper and lower control limits for a mean chart if you choose a sample size of 5 at Z=3. Show your calculations. Highlight or underline your solution.
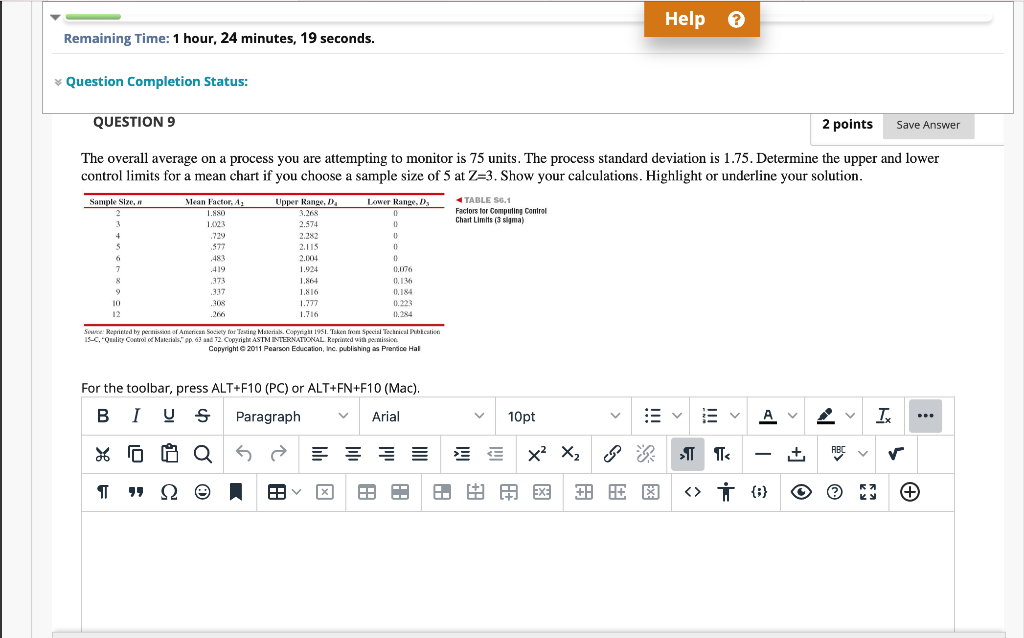
The overall average on a process you are attempting to monitor is 75 units. The process standard deviation is 1.75 . Determine the upper and lower control limits for a mean chart if you choose a sample size of 5 at Z=3. Show your calculations. Highlight or underline your solution. 4 TABLE SE.1 Factors for Compuring Control Chait Limits ( 3 silgma) The overall average on a process you are attempting to monitor is 75 units. The process standard deviation is 1.75 . Determine the upper and lower control limits for a mean chart if you choose a sample size of 5 at Z=3. Show your calculations. Highlight or underline your solution. 4 TABLE SE.1 Factors for Compuring Control Chait Limits ( 3 silgma)
Step by Step Solution
There are 3 Steps involved in it

Get step-by-step solutions from verified subject matter experts