The percentage changes in prepaid expenses and other current assets jumped up 16.5% in scal 2014 and
Question:
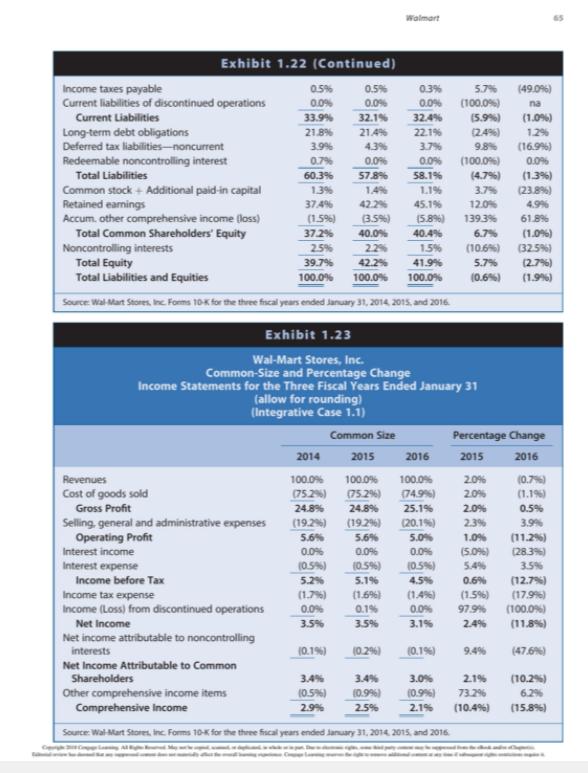
The percentage changes in prepaid expenses and other current assets jumped up 16.5% in fiscal 2014 and then fell by 35.2% in fiscal 2015. Did the changes in the dollar amounts of this account have a huge impact on total assets (see Exhibit 1.22)? Explain.
a. During this three-year period, how did the proportion of total liabilities change relative to the proportion of shareholders’ equity? What does this imply about changes in Wal-mart’s leverage?
b. How did net income as a percentage of total revenues change from fiscal 2013 to fiscal 2015? Identify the most important reasons for this change.
c. Does Walmart generate high or low profit margins? How do Walmart’s profit margins relate to the company’s strategy?
Walmart Exhibit 1.22 (Continued) 05% 0.5% 0.3% 5.7% (49.06) Income taxes payable Current liabilities of discontinued operations 0.0% 0.0% 0.0% (100.0%) na Current Liabilities 33.9% 32.1% 32.4% (5.9%) (1.0%) Long-term debt obligations Deferred tax liabilities-noncurrent Redeemable noncontrolling interest 21.8% 21.4% 22.1% (2.4%) 12% 3.9% 4.3% 3.7% 98% (16.9%) 0.7% 0.0% 0.0% (100.0%) 0.0% Total Liabilities 60.3% 57.8% 58.1% (4.7%) (1.3%) 1.3% 14% Common stock + Additional paid-in capital Retained earnings Accum. other comprehensive income (loss) Total Common Shareholders' Equity 1.1% 3.7% (23.8%) 37.4% 42.2% 45.1% 12.0% 4.9% (1.5%) (3.5%) (5.8%) 139.3% 61.8% 37.2% 40.0% 40.4% 6.7% (1.0%) Noncontrolling interests Total Equity Total Liabilities and Equities 2.5% 22% 15% (10.6%) (325%) 39.7% 42.2% 41.9% 5.7% (2.7%) 100.0% 100.0% 100.0% (0.6%) (1.9%) Source Wal-Mart Stores, Inc Forms 10K for the three fiscal years ended January 31, 2014, 2015, and 2016. Exhibit 1.23 Wal-Mart Stores, Inc. Common-Size and Percentage Change Income Statements for the Three Fiscal Years Ended January 31 (allow for rounding) (Integrative Case 1.1) Common Size Percentage Change 2014 2015 2016 2015 2016 Revenues 100.0% 100.0% 100.0% 2.0% (0.7%) Cost of goods sold (75.2%) (75.2%) (74.96) 2.0% (1.1%) Gross Profit 24.8% 24.8% 25.1% 2.0% 0.5% Selling, general and administrative expenses Operating Profit (20.1%) 2.3% 3.9% (19.2%) 5.6% (19.2%) 5.6% 5.0% 1.0% (11.2%) 0.0% 0.0% (5.0%) 5.4% Interest income 0.0% (28.3%) Interest expense (0.5%) (0.5%) (0.5%) 3.5% Income before Tax 5.2% 5.1% 4.5% 0.6% (12.7%) Income tax expense (1.7%) (1.66) (1.4%) (1.5%) (17.996) Income (Loss) from discontinued operations 0.0% 0.1% 0.0% 97.9% (100.0%) Net Income 3.5% 3.5% 3.1% 2.4% (11.8%) Net income attributable to noncontrolling interests (0.1%) (0.2%) (0.1%) 9.4% (47.6%) Net Income Attributable to Common Shareholders 3.4% 3.4% 3.0% 2.1% (10.2%) Other comprehensive income items Comprehensive Income (0.5%) (0.996) (0.96) 73.2% 6.2% 2.9% 2.5% 2.1% (10.4%) (15.8%) Source: Wal-Mart Stores, inc. Forms 10-K for the three fiscal years ended January 31, 2014. 2015, and 2016. Walmart Exhibit 1.22 (Continued) 05% 0.5% 0.3% 5.7% (49.06) Income taxes payable Current liabilities of discontinued operations 0.0% 0.0% 0.0% (100.0%) na Current Liabilities 33.9% 32.1% 32.4% (5.9%) (1.0%) Long-term debt obligations Deferred tax liabilities-noncurrent Redeemable noncontrolling interest 21.8% 21.4% 22.1% (2.4%) 12% 3.9% 4.3% 3.7% 98% (16.9%) 0.7% 0.0% 0.0% (100.0%) 0.0% Total Liabilities 60.3% 57.8% 58.1% (4.7%) (1.3%) 1.3% 14% Common stock + Additional paid-in capital Retained earnings Accum. other comprehensive income (loss) Total Common Shareholders' Equity 1.1% 3.7% (23.8%) 37.4% 42.2% 45.1% 12.0% 4.9% (1.5%) (3.5%) (5.8%) 139.3% 61.8% 37.2% 40.0% 40.4% 6.7% (1.0%) Noncontrolling interests Total Equity Total Liabilities and Equities 2.5% 22% 15% (10.6%) (325%) 39.7% 42.2% 41.9% 5.7% (2.7%) 100.0% 100.0% 100.0% (0.6%) (1.9%) Source Wal-Mart Stores, Inc Forms 10K for the three fiscal years ended January 31, 2014, 2015, and 2016. Exhibit 1.23 Wal-Mart Stores, Inc. Common-Size and Percentage Change Income Statements for the Three Fiscal Years Ended January 31 (allow for rounding) (Integrative Case 1.1) Common Size Percentage Change 2014 2015 2016 2015 2016 Revenues 100.0% 100.0% 100.0% 2.0% (0.7%) Cost of goods sold (75.2%) (75.2%) (74.96) 2.0% (1.1%) Gross Profit 24.8% 24.8% 25.1% 2.0% 0.5% Selling, general and administrative expenses Operating Profit (20.1%) 2.3% 3.9% (19.2%) 5.6% (19.2%) 5.6% 5.0% 1.0% (11.2%) 0.0% 0.0% (5.0%) 5.4% Interest income 0.0% (28.3%) Interest expense (0.5%) (0.5%) (0.5%) 3.5% Income before Tax 5.2% 5.1% 4.5% 0.6% (12.7%) Income tax expense (1.7%) (1.66) (1.4%) (1.5%) (17.996) Income (Loss) from discontinued operations 0.0% 0.1% 0.0% 97.9% (100.0%) Net Income 3.5% 3.5% 3.1% 2.4% (11.8%) Net income attributable to noncontrolling interests (0.1%) (0.2%) (0.1%) 9.4% (47.6%) Net Income Attributable to Common Shareholders 3.4% 3.4% 3.0% 2.1% (10.2%) Other comprehensive income items Comprehensive Income (0.5%) (0.996) (0.96) 73.2% 6.2% 2.9% 2.5% 2.1% (10.4%) (15.8%) Source: Wal-Mart Stores, inc. Forms 10-K for the three fiscal years ended January 31, 2014. 2015, and 2016.
Expert Answer:
A During this threeyear period the proportion of total assets financed by total liabil... View the full answer
Students also viewed these accounting questions
-
A short-run aggregate supply curve shows fixed supply curve shows fixed_ A) output; output B) output; prices C) prices; output D) prices; prices and a long-run aggregate
-
The following table summarizes the percentage changes in operating income, percentage changes in revenue, and betas for four pharmaceutical firms. a. Calculate the degree of operating leverage for...
-
What are the percentage changes in allocation at each hub using the two different bases? Jet Green Airways historically distributes the indirect costs of lost and damaged baggage to its three major...
-
Water is an essential resource. For that reason moral considerations exert considerable pressure to assure that everyone has access to at least enough water to survive. Yet it appears that equity and...
-
What is the ABC inventory matrix, and how is it used to manage inventory?
-
Problem refer to the following transition matrix P and its powers: Find the probability of going from state B to state B in three trials. 43 2 .25 37 A B A C A.6 .3 P = B.2 .5 .3 CL.1 .1 .35 .22...
-
Mens heights. The distribution of heights of young men is approximately Normal with mean 70 inches and standard deviation 2.5 inches. Sketch a Normal curve on which this mean and standard deviation...
-
The year 1987 featured extreme volatility on the stock market, including a loss of over 20 percent of the markets value on a single day. Figure 7.6 (a) shows the percent frequency histogram of the...
-
The Rouse Corporation has the following account balances (in millions): (Click the icon to view the account balances.) Requirement Prepare an income statement and a supporting schedule of cost of...
-
The following table summarizes the operating results for Bene Petits first year of operations: Bene Petit First year operating data: Single (1 serving) Dual (2 servings) Family (4 servings) Total...
-
Linear programming theory states that the optimum lies on a corner. All three solution techniques make use of the corner point feature. What are the four requirements of a linear programming problem?
-
Find the explained variation for the paired data. The equation of the regression line for the paired data below is y = 5.18286 + 3.33937x. X 972 23 34 4 22 17 y 43 35 16 21 23 102 81
-
5. The vertical stress at a point is 28 kPa, while the horizontal stress is 14 kPa. shear stress on the horizontal plane is +4 kPa. The (a) Draw the Mohr's circle of stress and show the pole point...
-
I need assistance with the below questions for my HIM 5370 at texas State University Case Mix Table: 4. Complete the Case Mix table shown below. Calculate the case mix for each month. The table below...
-
The probability that a printing press will print a book with no errors is 78%. The company is about to process an order of 30 books. Round decimals to 3 places or percentages to 1 decimal place. 9....
-
alculate Product Costs, using JOB COSTING SYSTEM. Please SHOW CALCULATION. Dream Chocolate Company: Choosing a Costing System TABLE 1 Typical Prices and Costs of Chocolate 641 1.25 oz. Bar 3.0 oz....
-
Score: 3.24 of 6 pts P10-31A (similar to) Question Help On January 2, 2018, Swity Delivery Service purchased a truck at a cost of $62,000. Before placing the truck in service, Swifty spent $3,000...
-
A bar of a steel alloy that exhibits the stress-strain behavior shown in Figure 6.22 is subjected to a tensile load; the specimen is 375 mm (14.8 in.) long and has a square cross section 5.5 mm (0.22...
-
You are analyzing a convertible preferred stock with the following characteristics for the security: There are 50,000 preferred shares outstanding, with a face value of $100 and a 6% preferred...
-
Assume now that Office Helpers decides to go public and would like to offer its shares at a target price of $10 per share. If the IPO is likely to be underpriced by 20%, how many shares should the...
-
You are analyzing an investment decision, in which you will have to make an initial investment of $10 million and you will be generating annual cash flows to the firm of $2 million every year,...
-
Jamie Lee has decided to purchase a certified, preowned vehicle. What might she expect as far as reliability and a warranty on the used car?
-
What daily spending items are amounts that might be reduced or eliminated to allow for higher savings amounts?
-
Jamie Lee is attracted to the low monthly payment advertised for a vehicle lease. She may well be able to afford a more expensive car than she originally thought. Jamie Lee really needs to think this...
![Mobile App Logo](https://dsd5zvtm8ll6.cloudfront.net/includes/images/mobile/finalLogo.png)
Study smarter with the SolutionInn App