

Question: The phase diagram for NixTi1-x (0 < x < 1) is shown in the figure below. Weight Percent Nickel 40 10 20 30 50
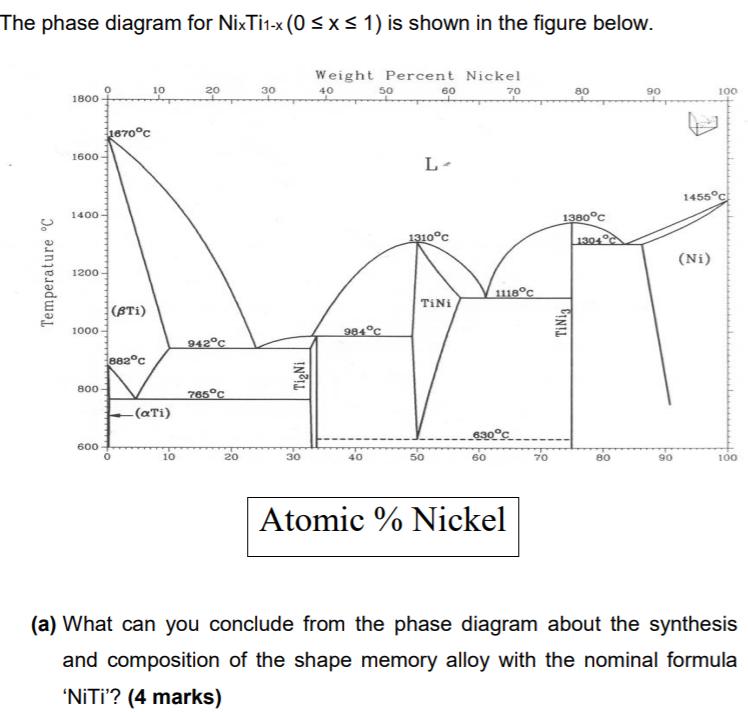

The phase diagram for NixTi1-x (0 < x < 1) is shown in the figure below. Weight Percent Nickel 40 10 20 30 50 60 70 80 90 100 1800 1870c 1600 L- 1455c 1400 1380c 1310c 1304 (Ni) 1200 1118C TINI (STI) 1000 984C 942c ea2c 800 765c -(aTi) 600 10 20 30 50 60 70 80 90 100 Atomic % Nickel (a) What can you conclude from the phase diagram about the synthesis and composition of the shape memory alloy with the nominal formula 'NITI'? (4 marks) Temperature C INL TINig (b) The phase transition temperature for the austenite/martensite phase transition as a function of composition of 'NITI' is shown in the figure below. 100 50 -50 -100- -150+ 0.46 0.47 0.48 0.49 0.50 0.51 0.52 0.53 x in NijxTix Comment on the usefulness of this material as a shape memory alloy across the given composition range (hint: keep in mind potential applications). (6 marks) Transition temperature ("C)
Step by Step Solution
3.45 Rating (148 Votes )
There are 3 Steps involved in it
a Conclusion from the Phase Diagram for NiTi Alloy 1 Phase Composition The phase diagram for NiTi shows different phases such as L liquid Ti Ti and in... View full answer

Get step-by-step solutions from verified subject matter experts