

Question: The pic for the data is attached. 1. Given the sugarcane supply response problem, using bangla.xls (34 annual observations). estimate the following model with no
 The pic for the data is attached.
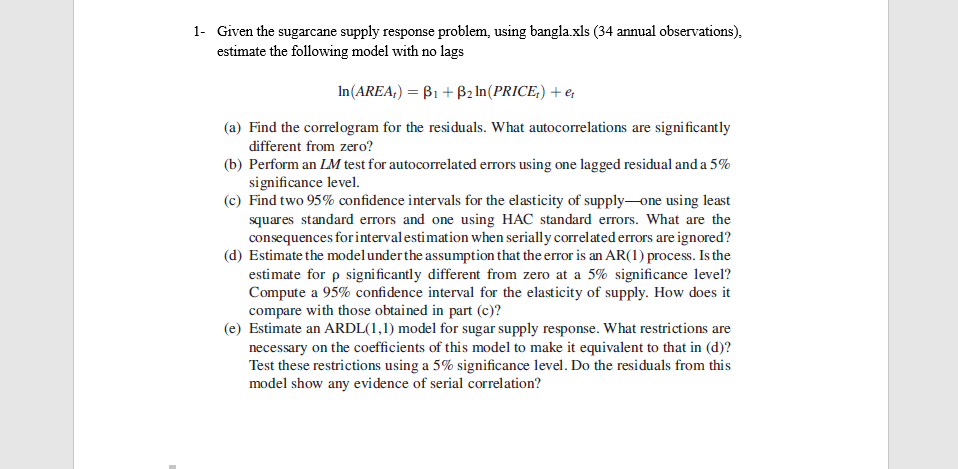
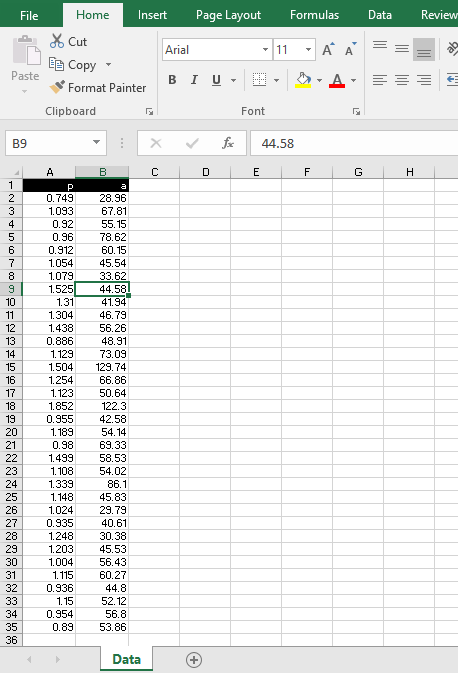
1. Given the sugarcane supply response problem, using bangla.xls (34 annual observations). estimate the following model with no lags In(AREA:) = B1 + B2 In(PRICE) + (a) Find the correlogram for the residuals. What autocorrelations are significantly different from zero? (6) Perform an LM test for autocorrelated errors using one lagged residual and a 5% significance level. (c) Find two 95% confidence intervals for the elasticity of supplyone using least squares standard errors and one using HAC standard errors. What are the consequences for interval estimation when serially correlated errors are ignored? (d) Estimate the model under the assumption that the error is an AR(1) process. Is the estimate for p significantly different from zero at a 5% significance level? Compute a 95% confidence interval for the elasticity of supply. How does it compare with those obtained in part (c)? (e) Estimate an ARDL(1,1) model for sugar supply response. What restrictions are necessary on the coefficients of this model to make it equivalent to that in (d)? Test these restrictions using a 5% significance level. Do the residuals from this model show any evidence of serial correlation? File Home Insert Page Layout Formulas Data Review * Cut BB Copy Arial 11 Paste BIU Format Painter Clipboard Font B9 : X 44.58 P B E F . 1 2 3 4 5 6 7 8 9 10 11 12 13 14 15 16 17 18 19 20 21 22 23 24 25 26 27 28 29 30 31 32 33 34 35 36 P 0.749 1.093 0.92 0.96 0.912 1.054 1.079 1.525 1.31 1.304 1.438 0.886 1.129 1.504 1.254 1.123 1.852 0.955 1.189 0.98 1.499 1.108 1.339 1148 1.024 0.935 1.248 1.203 1.004 1.115 0.936 1.15 0.954 0.89 28.96 67.81 55.15 78.62 60.15 45.54 33.62 44.58 41.94 46.79 56.26 48.91 73.09 129.74 66.86 50.64 122.3 42.58 54.14 69.33 58.53 54.02 86.1 45.83 29.79 40.61 30.38 45.53 56.43 60.27 44.8 52.12 56.8 53.86 Data + 1. Given the sugarcane supply response problem, using bangla.xls (34 annual observations). estimate the following model with no lags In(AREA:) = B1 + B2 In(PRICE) + (a) Find the correlogram for the residuals. What autocorrelations are significantly different from zero? (6) Perform an LM test for autocorrelated errors using one lagged residual and a 5% significance level. (c) Find two 95% confidence intervals for the elasticity of supplyone using least squares standard errors and one using HAC standard errors. What are the consequences for interval estimation when serially correlated errors are ignored? (d) Estimate the model under the assumption that the error is an AR(1) process. Is the estimate for p significantly different from zero at a 5% significance level? Compute a 95% confidence interval for the elasticity of supply. How does it compare with those obtained in part (c)? (e) Estimate an ARDL(1,1) model for sugar supply response. What restrictions are necessary on the coefficients of this model to make it equivalent to that in (d)? Test these restrictions using a 5% significance level. Do the residuals from this model show any evidence of serial correlation? File Home Insert Page Layout Formulas Data Review * Cut BB Copy Arial 11 Paste BIU Format Painter Clipboard Font B9 : X 44.58 P B E F . 1 2 3 4 5 6 7 8 9 10 11 12 13 14 15 16 17 18 19 20 21 22 23 24 25 26 27 28 29 30 31 32 33 34 35 36 P 0.749 1.093 0.92 0.96 0.912 1.054 1.079 1.525 1.31 1.304 1.438 0.886 1.129 1.504 1.254 1.123 1.852 0.955 1.189 0.98 1.499 1.108 1.339 1148 1.024 0.935 1.248 1.203 1.004 1.115 0.936 1.15 0.954 0.89 28.96 67.81 55.15 78.62 60.15 45.54 33.62 44.58 41.94 46.79 56.26 48.91 73.09 129.74 66.86 50.64 122.3 42.58 54.14 69.33 58.53 54.02 86.1 45.83 29.79 40.61 30.38 45.53 56.43 60.27 44.8 52.12 56.8 53.86 Data +
Step by Step Solution
There are 3 Steps involved in it

Get step-by-step solutions from verified subject matter experts