

Question: The plot below represents the function f(x): 5+ 4 3 N 2 1 -5 -4 -3 -2 -1 -1 -2 23 1/2 3 4
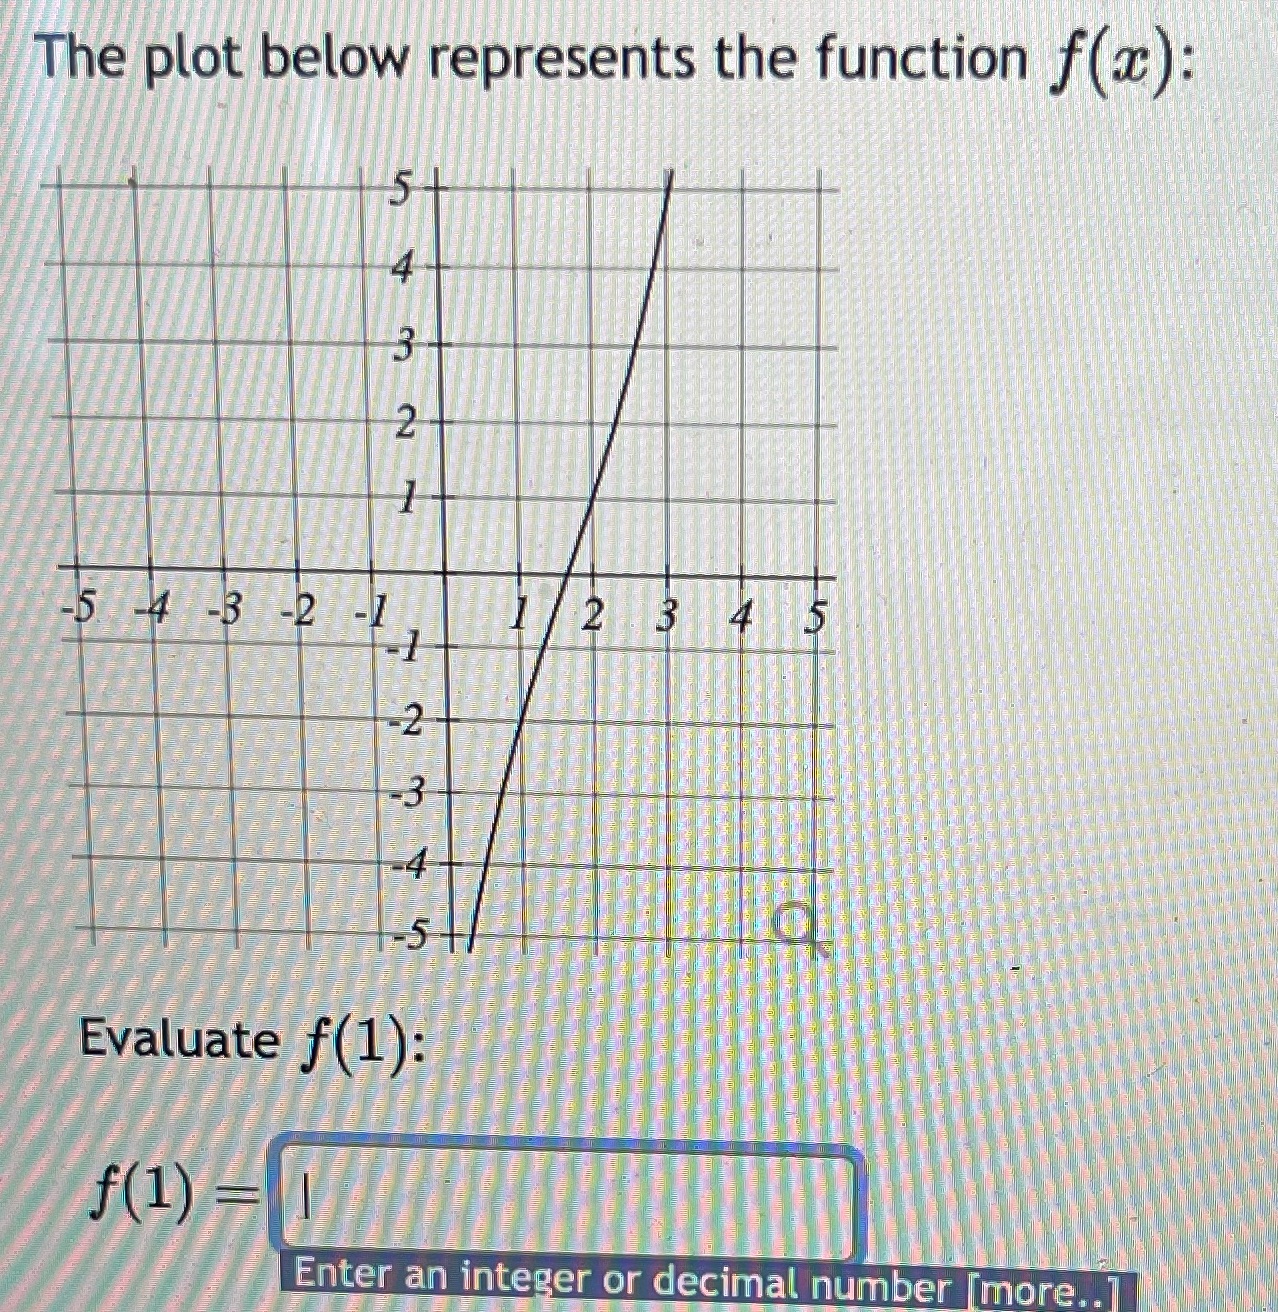
The plot below represents the function f(x): 5+ 4 3 N 2 1 -5 -4 -3 -2 -1 -1 -2 23 1/2 3 4 -3 -4- -51 Evaluate f(1): f(1) = 1 Enter an integer or decimal number [more..]
Step by Step Solution
There are 3 Steps involved in it
1 Expert Approved Answer
Step: 1 Unlock

Question Has Been Solved by an Expert!
Get step-by-step solutions from verified subject matter experts
Step: 2 Unlock
Step: 3 Unlock