

Question: The plot below shows simulated data of differences in mean trust ratings between members of the public and scientists. The participants had read a news

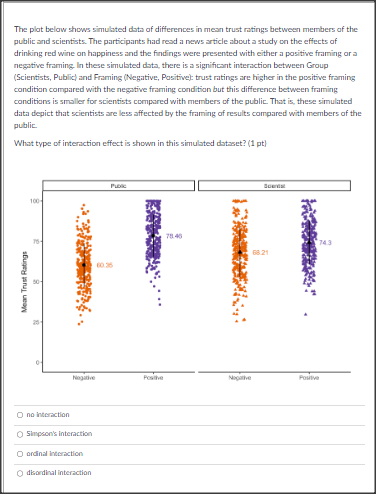
The plot below shows simulated data of differences in mean trust ratings between members of the public and scientists. The participants had read a news article about a study on the effects of drinking red wine on happiness and the findings were presented with either a positive framing or a negative framing. In these simulated data, there is a significant interaction between Group (Scientists, Public) and Framing (Negative, Positivek: trust ratings are higher in the positive framing condition compared with the negative framing condition but this difference between framing conditions is smaller for scientists compared with members of the public. That is, these simulated data depict that scientists are less affected by the framing of results compared with members of the public. What type of interaction effect is shown in this simulated dataset? (1 pt] 100 743 68.21 Mean Trust Ratings O no interaction Simpson's interaction Q ordinal interaction disordinal interaction
Step by Step Solution
There are 3 Steps involved in it

Get step-by-step solutions from verified subject matter experts