

Question: The plot needs to be made in r if possible. Include the code for this please. A price promotion study. How does the frequency that
The plot needs to be made in r if possible. Include the code for this please.
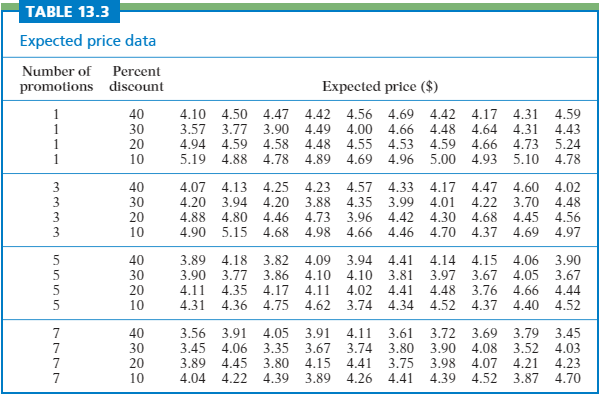
A price promotion study. How does the frequency that a supermarket product is promoted at a discount affect the price that customers expect to pay for the product? Does the percent reduction also affect this expectation? These questions were examined by researchers in a study conducted on students enrolled in an introductory management course at a large midwestern university. For 10 weeks 160 subjects received information about the products. The treatment conditions corresponded to the number of promotions (1, 3, 5, or 7) that were described during this 10-week period and the percent that the product was discounted (10%, 20%, 30%, and 40%). Ten students were randomly TABLE 13.3 Expected price data Number of Percent promotions discount 1 40 1 30 1 20 1 10 Expected price ($) 4.10 4.50 4.47 4.42 4.56 4.69 4.42 4.17 4.31 4.59 3.57 3.77 3.90 4.49 4.00 4.66 4.48 4.64 4.31 4.43 4.94 4.59 4.58 4.48 4.55 4.53 4.59 4.66 4.73 5.24 5.19 4.88 4.78 4.89 4.69 4.96 5.00 4.93 5.10 4.78 3 3 3 3 40 30 20 10 4.07 4.13 4.25 4.23 4.57 4.33 4.17 4.47 4.60 4.02 4.20 3.94 4.20 3.88 4.35 3.99 4.01 4.22 3.70 4.48 4.88 4.80 4.46 4.73 3.96 4.42 4.30 4.68 4.45 4.56 4.90 5.15 4.68 4.98 4.66 4.46 4.70 4.37 4.69 4.97 40 30 20 10 3.89 4.18 3.82 4.09 3.94 4.41 4.14 4.15 4.06 3.90 3.90 3.77 3.86 4.10 4.10 3.81 3.97 3.67 4.05 3.67 4.11 4.35 4.17 4.11 4.02 4.41 4.48 3.76 4.66 4.44 4.31 4.36 4.75 4.62 3.74 4.34 4.52 4.37 4.40 4.52 5 7 7 7 40 30 20 10 3.56 3.91 4.05 3.91 4.11 3.61 3.45 4.06 3.35 3.67 3.74 3.80 3.89 4.45 3.80 4.15 4.41 3.75 4.04 4.22 4.39 3.89 4.26 4.41 3.72 3.69 3.79 3.45 3.90 4.08 3.52 4.03 3.98 4.07 4.21 4.23 4.39 4.52 3.87 4.70 assigned to each of the 4 x 4 = 16 treatments." Table 13.3 gives the data. (a) Summarize the means and standard deviations in a table and plot the means. Summarize the main features of the plot. (b) Analyze the data with a two-way ANOVA. Report the results of this analysis. (c) Using your plot and the ANOVA results, prepare a short report explaining how the expected price depends on the number of promotions and the percent of the discount
Step by Step Solution
There are 3 Steps involved in it

Get step-by-step solutions from verified subject matter experts