

Question: The plot placed below represents a tree model predicting the people who are likely to opt for a loan from a bank. The plot
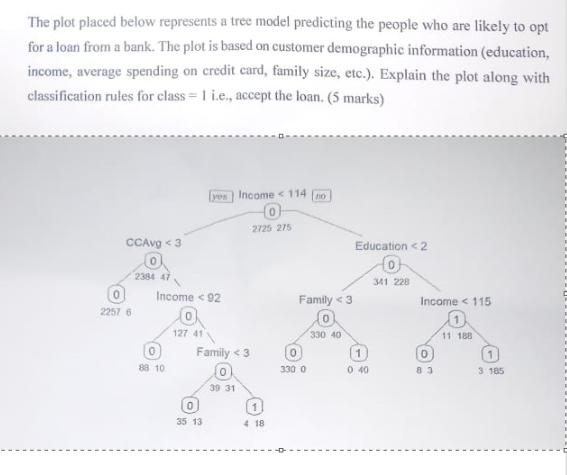
The plot placed below represents a tree model predicting the people who are likely to opt for a loan from a bank. The plot is based on customer demographic information (education, income, average spending on credit card, family size, etc.). Explain the plot along with classification rules for class= 1 i.e., accept the loan. (5 marks) CCAvg
Step by Step Solution
3.36 Rating (143 Votes )
There are 3 Steps involved in it
The plot youve provided appears to be a visual representation of a decision tree model used for predicting loan acceptance class 1 based on customer demographic information Each node in the tree repre... View full answer

Get step-by-step solutions from verified subject matter experts