

Question: The plot shown below is the residual against the fitted value (??) to check the constant variance assumption error term ?. a) Does the above
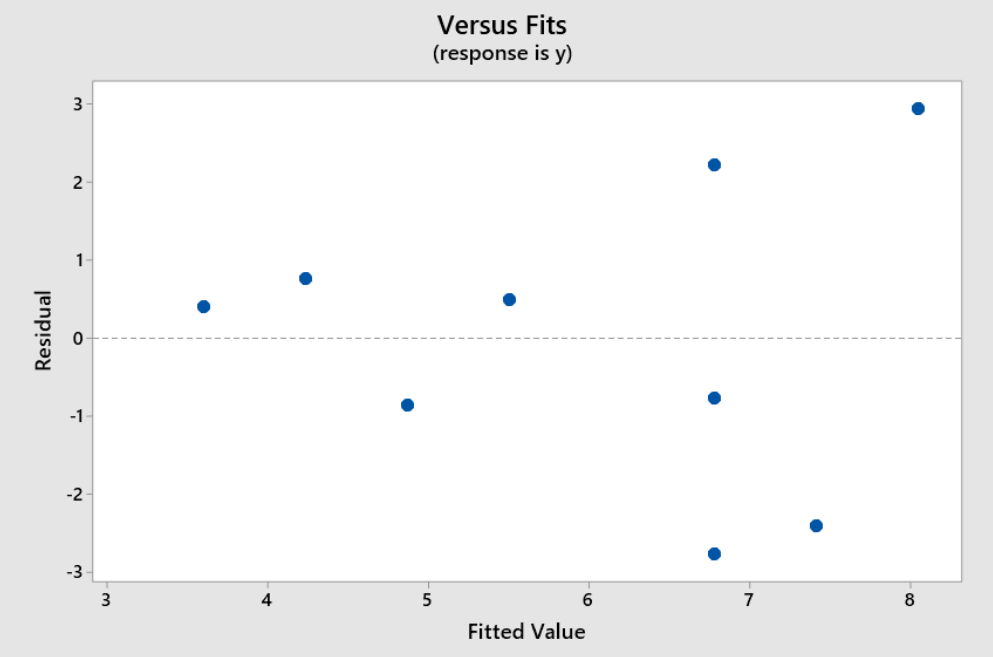
The plot shown below is the residual against the fitted value (??) to check the constant variance assumption error term ?.
a) Does the above plot support the assumptions about error term ?? Please explain the reason for your answer.
b) Give two different approaches to correct when the constant variance assumption is violated.
c) Define the term interaction in general linear model.
\f
Step by Step Solution
There are 3 Steps involved in it
1 Expert Approved Answer
Step: 1 Unlock

Question Has Been Solved by an Expert!
Get step-by-step solutions from verified subject matter experts
Step: 2 Unlock
Step: 3 Unlock