

Question: The plots below compare the results from two different tests taken by the same students: 0 Test 2 H Test 1 6 8 10
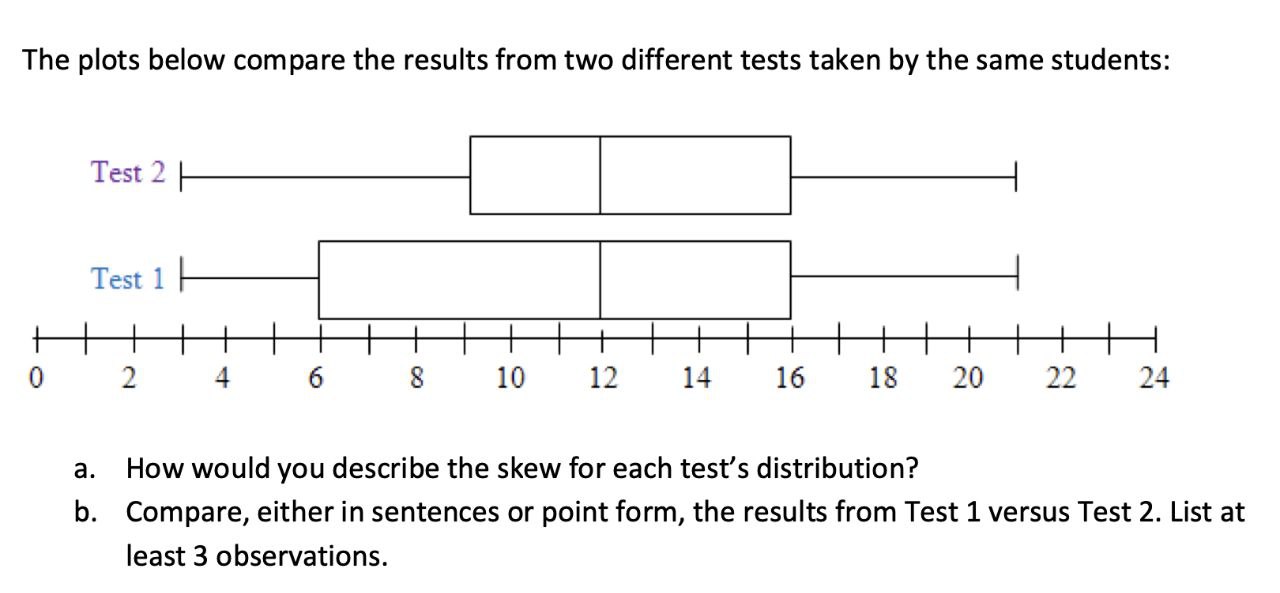
The plots below compare the results from two different tests taken by the same students: 0 Test 2 H Test 1 6 8 10 12 14 16 18 20 22 24 a. How would you describe the skew for each test's distribution? b. Compare, either in sentences or point form, the results from Test 1 versus Test 2. List at least 3 observations.
Step by Step Solution
There are 3 Steps involved in it
1 Expert Approved Answer
Step: 1 Unlock

Question Has Been Solved by an Expert!
Get step-by-step solutions from verified subject matter experts
Step: 2 Unlock
Step: 3 Unlock