

Question: The plots below show the outcomes from three different experiments aiming at testing if there's a difference in mean outcomes between groups A, B, and
The plots below show the outcomes from three different experiments aiming at testing if there's a difference in mean outcomes between groups A, B, and C. Group means are indicated by the horizontal lines.
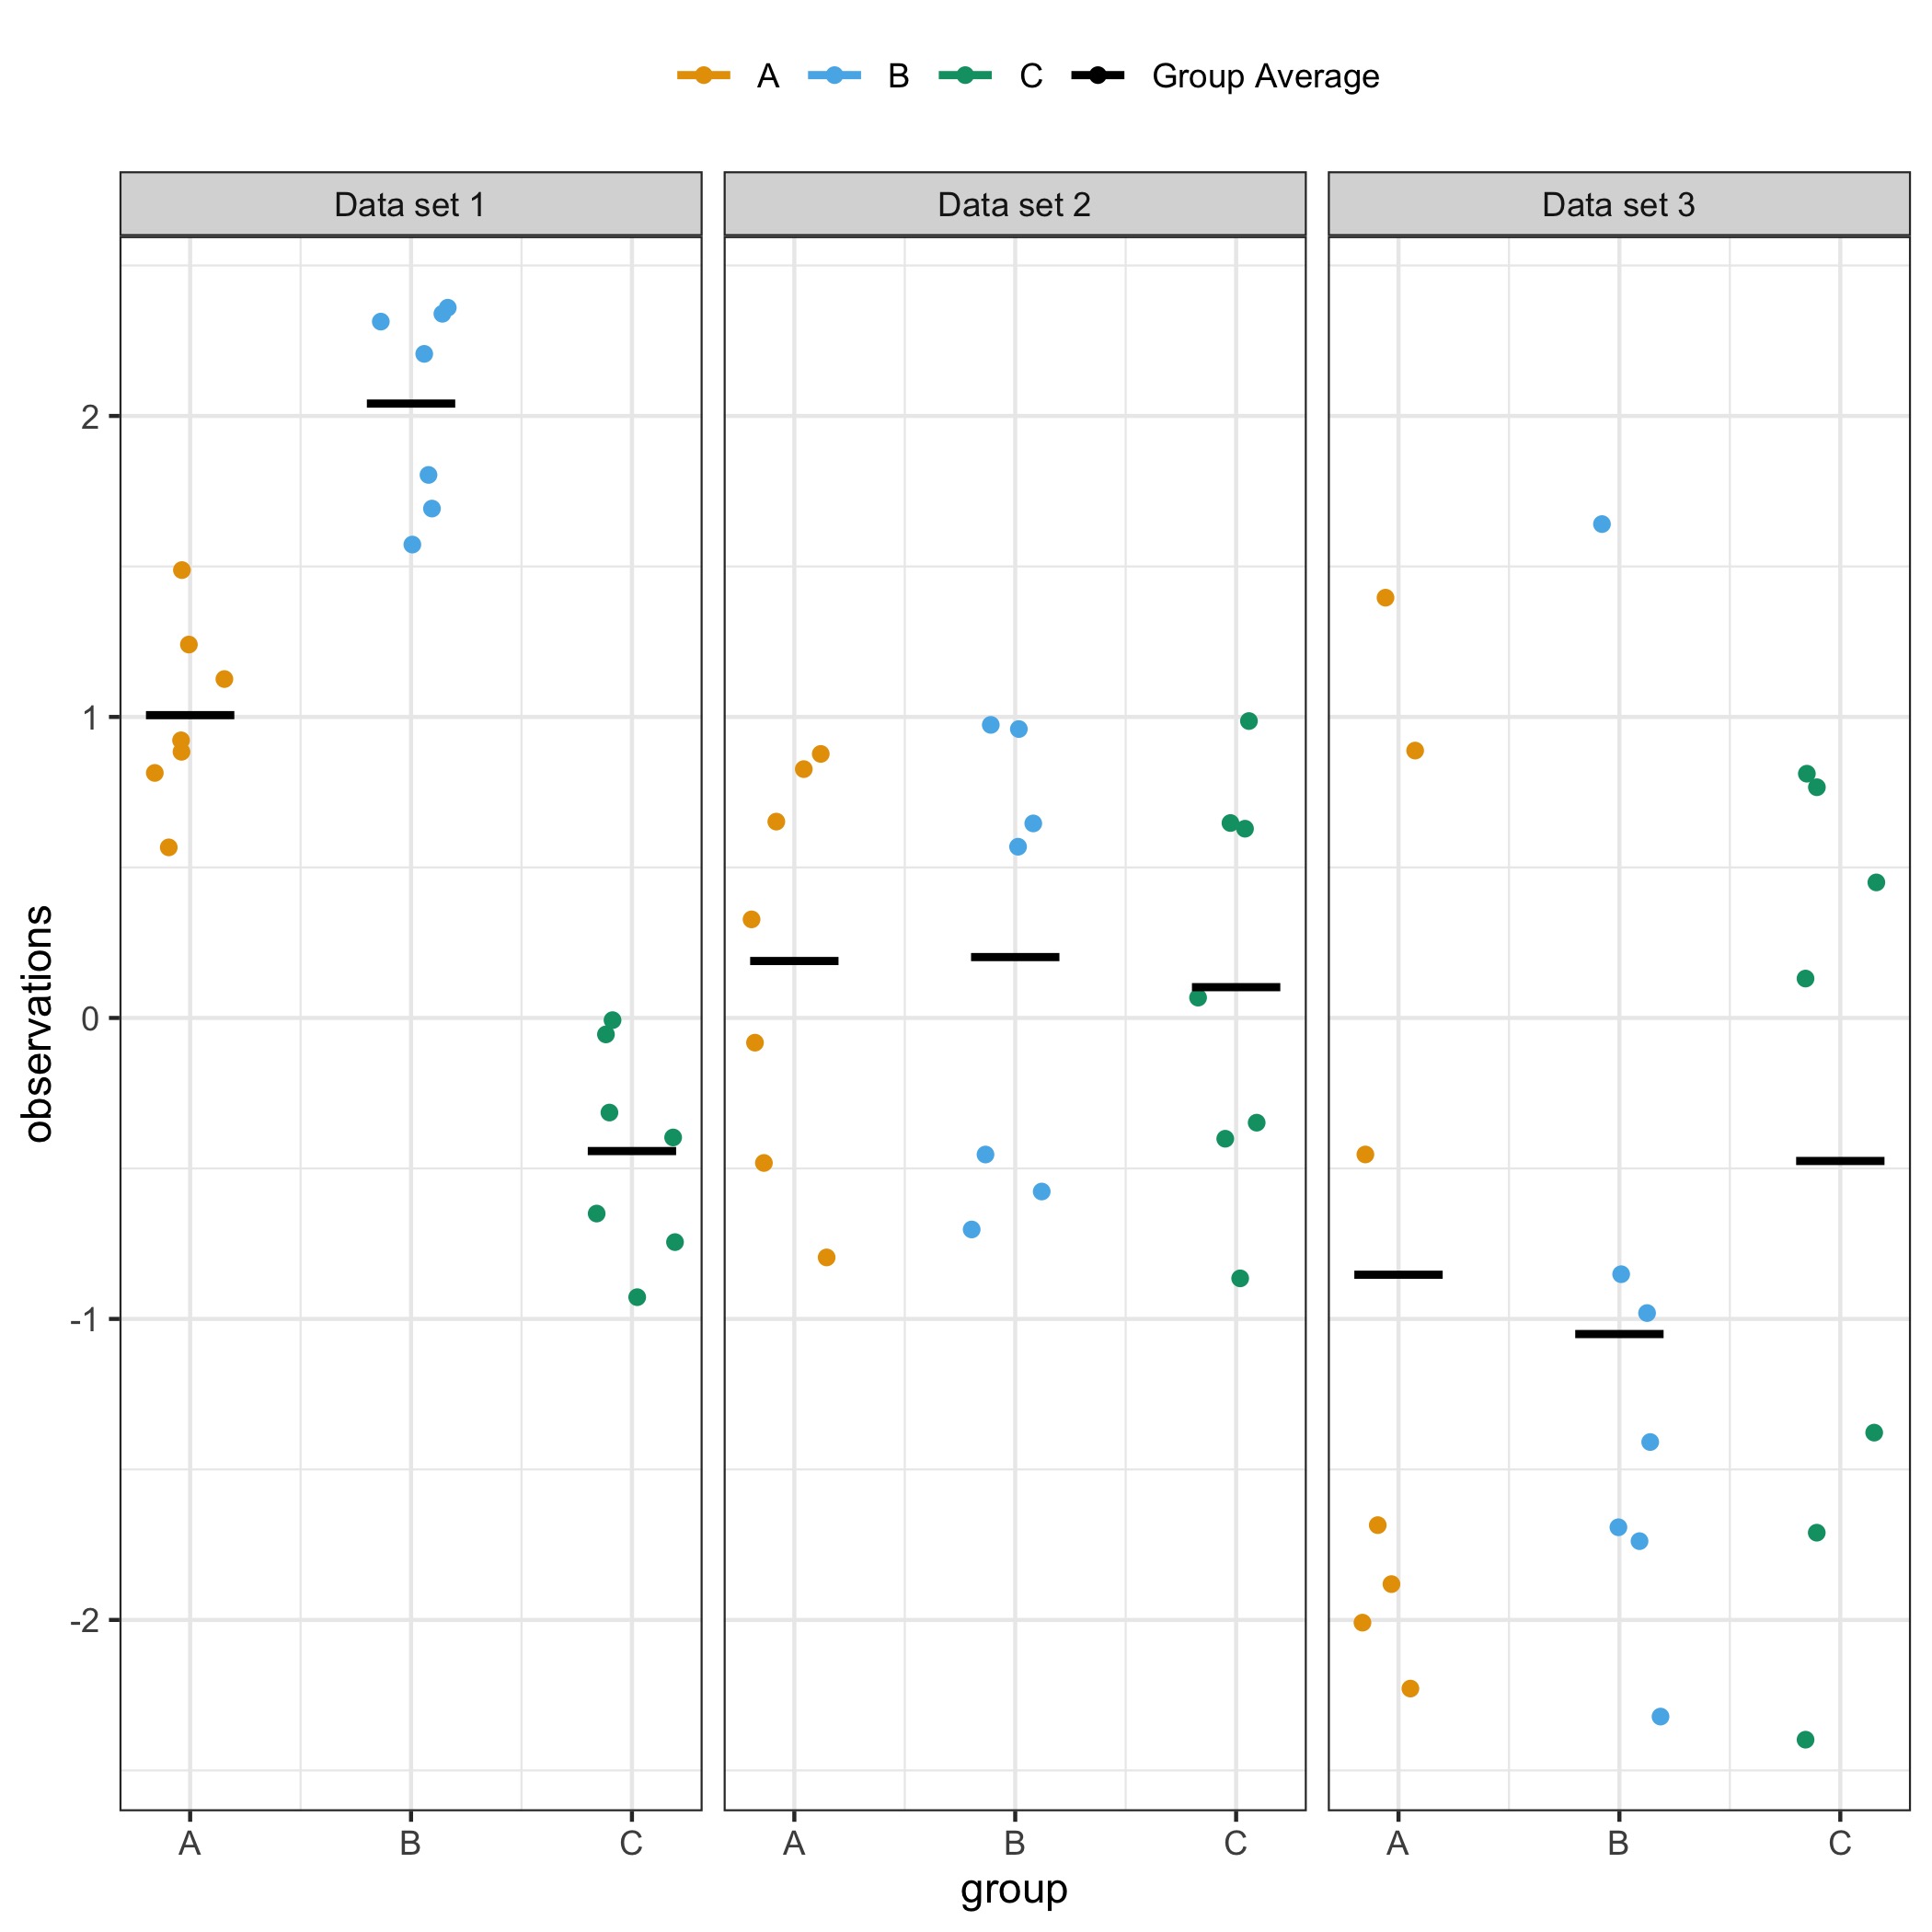
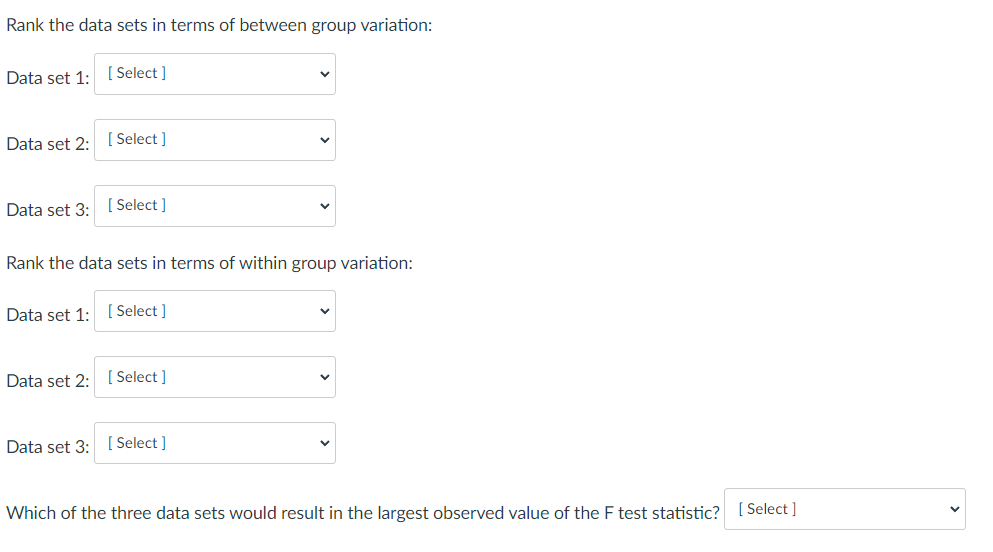
A B - C - Group Average Data set 1 Data set 2 Data set 3 2 . . . . . . -.. . 0 - . observations . -1 - . . . -2 A C A C A C groupRank the data sets in terms of between group variation: Data set 1: [ Select ] Data set 2: [ Select ] Data set 3: [ Select ] Rank the data sets in terms of within group variation: Data set 1: [ Select ] Data set 2: [ Select ] Data set 3: [ Select ] Which of the three data sets would result in the largest observed value of the F test statistic? [ Select ]
Step by Step Solution
There are 3 Steps involved in it

Get step-by-step solutions from verified subject matter experts