

Question: The position as a function of the time graph for an Olympic-class sprinter during a race is shown in the figure. The data are fit
The position as a function of the time graph for an Olympic-class sprinter during a race is shown in the figure. The data are fit to the function shown on the figure.
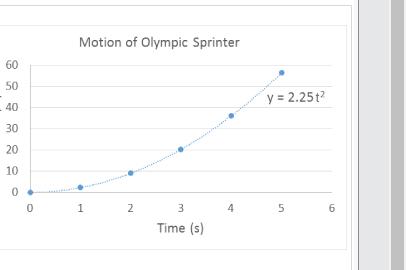
60 50 40 30 2220 10 Motion of Olympic Sprinter y = 2.25t 0 0 1 2 3 4 5 6 Time (s)
Step by Step Solution
There are 3 Steps involved in it
1 Expert Approved Answer
Step: 1 Unlock

Question Has Been Solved by an Expert!
Get step-by-step solutions from verified subject matter experts
Step: 2 Unlock
Step: 3 Unlock