

Question: The position vs. time graph in the figure shows the position of a particle as it travels along the xaxis. .r {m} 4.0 - [{5}
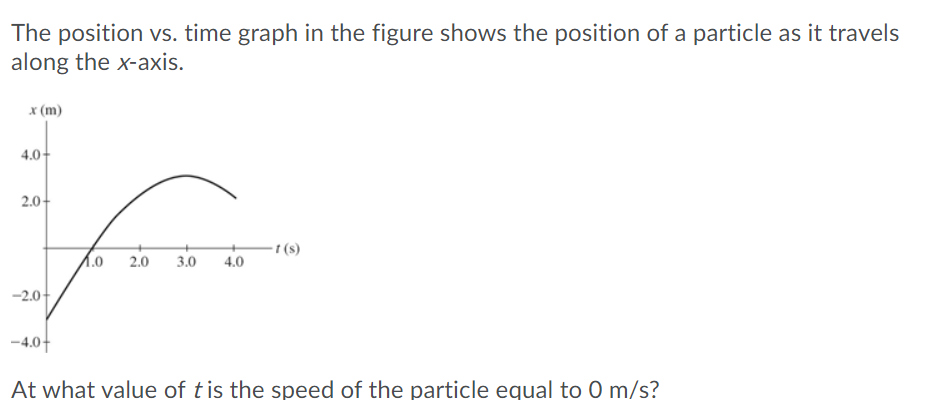
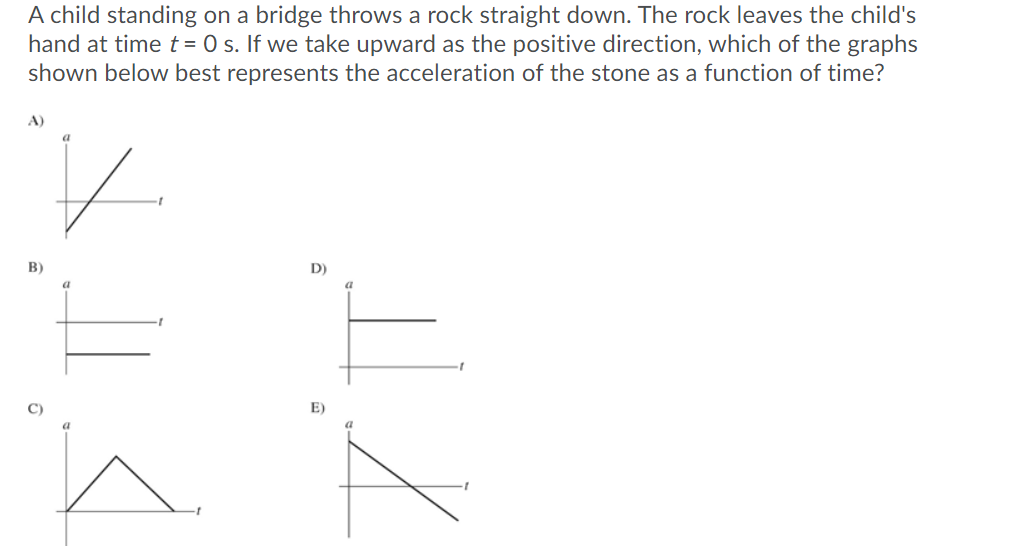
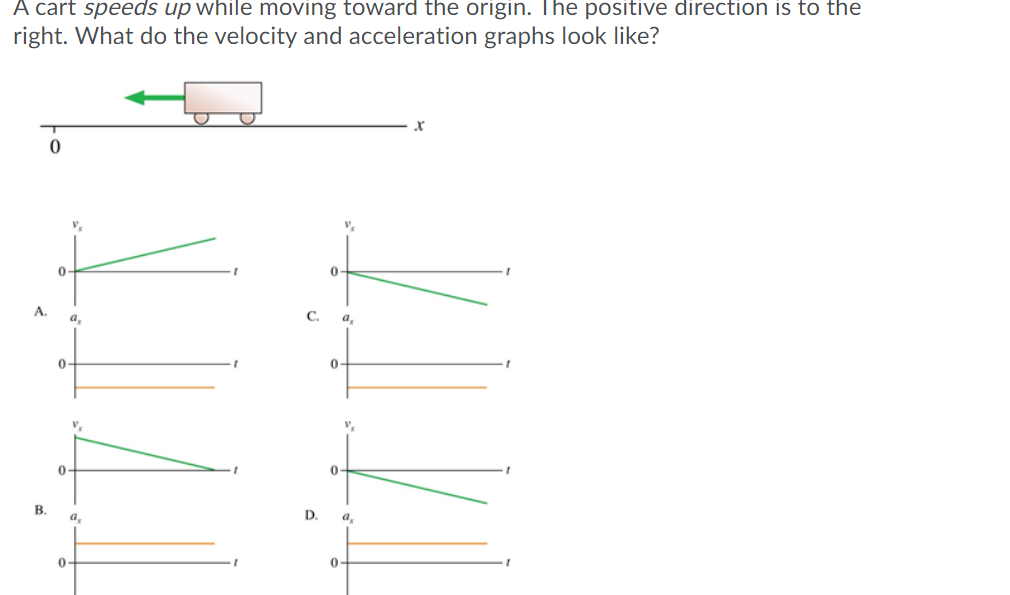
The position vs. time graph in the figure shows the position of a particle as it travels along the xaxis. .r {m} 4.0 - [{5} At what value of tis the speed of the particle equal to 0 m/s? A child standing on a bridge throws a rock straight down. The rock leaves the child's hand at time t = 0 s. If we take upward as the positive direction, which of the graphs shown below best represents the acceleration of the stone as a function of time? A} I! %l B]: D) I! {I l' | :l' C} E} I! a f f A cart speeds up while moving toward the origin. l he positive direction is to the right. What do the velocity and acceleration graphs look like? 0' 0%1 0%! A a. C. a. oi:' 4:. 0%: 0k! 3' n D. a
Step by Step Solution
There are 3 Steps involved in it

Get step-by-step solutions from verified subject matter experts