

Question: The previous section discussed calculating descriptive statistics using ex post (historical) data. This method is effective for describing past events. In addition, you can use
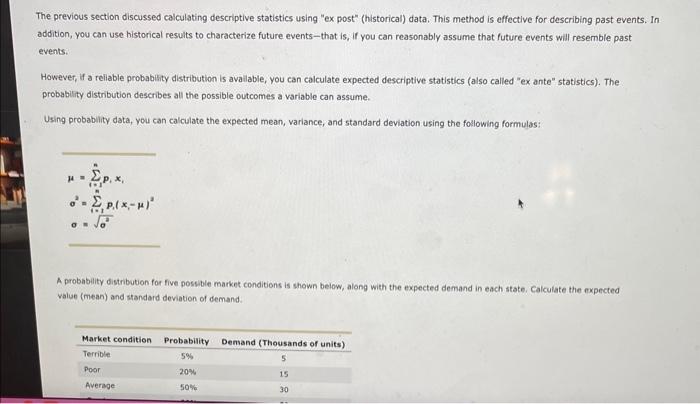
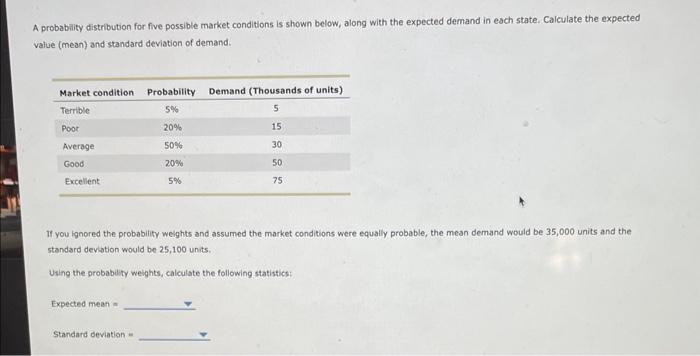
The previous section discussed calculating descriptive statistics using "ex post" (historical) data. This method is effective for describing past events. In addition, you can use historical results to characterize future events-that is, if you can reasonably assume that future events will resemble past events. However, if a reliable probability distribution is available, you can calculate expected descriptive statistics (also called "ex ante" statistics). The probability distribution describes all the possible outcomes a variable can assume. Using probablity data, you can calculate the expected mean, variance, and standard deviation using the following formulas: =i=1npix1o2=i=1np1(x,)2o=2 A probability distribution for five poswble market conditions is shown below, along with the expected demand in each state. Calculate the expected value (mean) and standard deviation of demand. A probabiity distribution for five possible market conditions is shown below, along with the expected demand in each state. Calculate the expected value (mean) and standard deviation of demand. If you lgnored the probability weights and assumed the market conditions were equally probable, the mean demand would be 35,000 units and the standard deviation would be 25,100 units. Uring the probability weights, calculate the following statistics: Expected mean = Standard devation =
Step by Step Solution
There are 3 Steps involved in it

Get step-by-step solutions from verified subject matter experts