

Question: The previous section discussed calculating descriptive statlstics using ex post (historical) data. This method is effective for describing past events. In addition, you can use
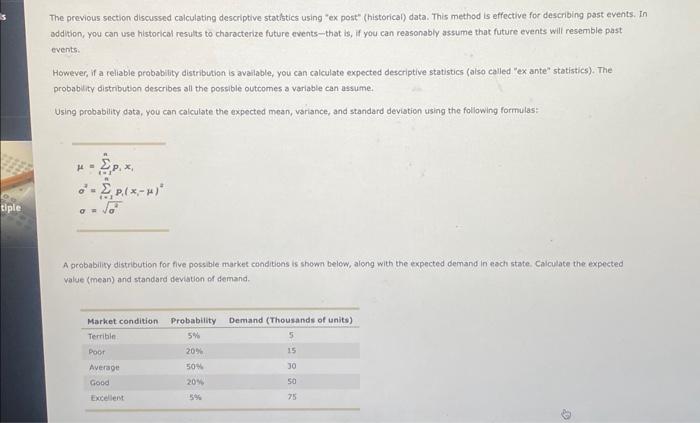
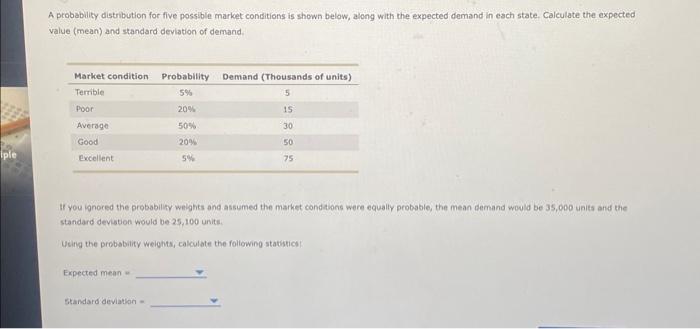
The previous section discussed calculating descriptive statlstics using "ex post" (historical) data. This method is effective for describing past events. In addition, you can use histocical results to characterize future events - that is, if you can reasonably assume that future events will resemble past events: However, if a reliable probability distribution is avalable, you can calculate expected descriptive statistics (also called "ex ante" statistics). The probabulity distribution describes all the possible outcomes a variable can assume. Using probabiticy data, you can calculate the expected mean, varisnce, and staridard deviation using the following formulas: =i=1npixin=i=1nPi(xi)2=2 A peababiliky distribution for five possible market conditions is shown below, along with the expected demand in each state. Calculate the expected value (mean) and standard devistion of demand. A probability distribution for five possible market conditions is shown below, along with the expected demand in each state. Calculate the expected value (mean) and standard deviation of demand. If you ignored the probabilicy welghts and assumed the market conditons were equally probable, the mean demand would be 35,000 sinits and the standard devition would be 25,100 units. Usirg the probability welohts, calculate the foliowing statisticaf Expected mean * Standard deviation =
Step by Step Solution
There are 3 Steps involved in it

Get step-by-step solutions from verified subject matter experts