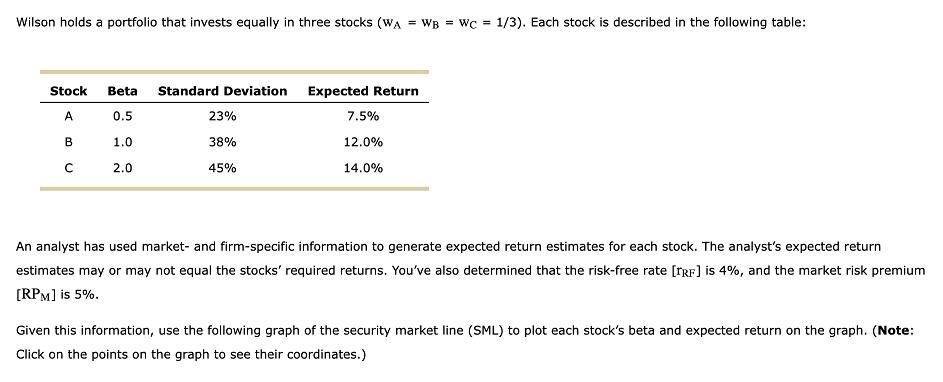
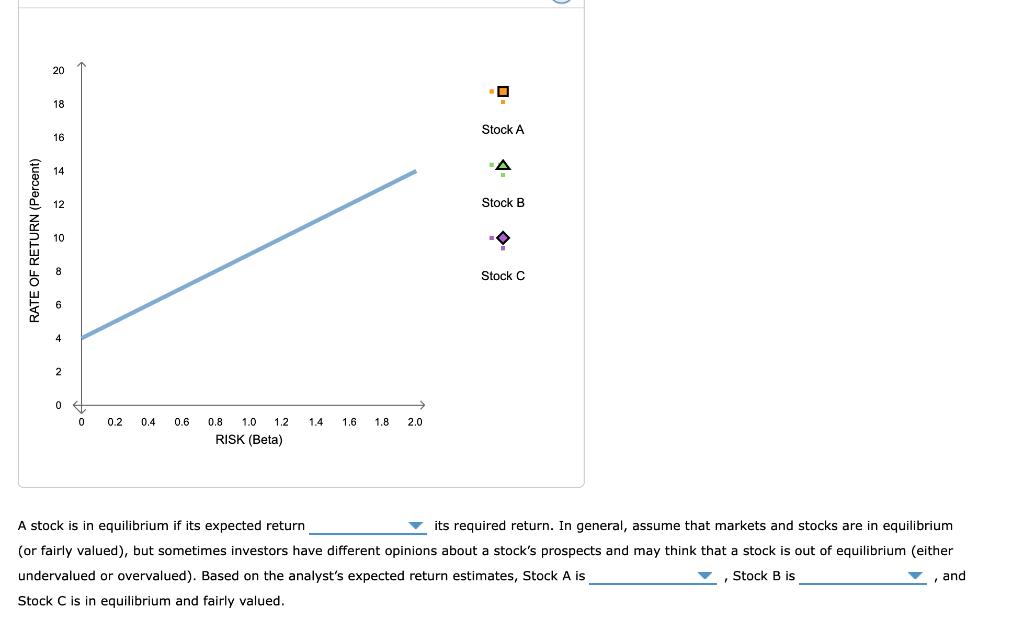
Wilson holds a portfolio that invests equally in three stocks (WA = WB = WC =...
Fantastic news! We've Found the answer you've been seeking!
Question:
Transcribed Image Text:
Wilson holds a portfolio that invests equally in three stocks (WA = WB = WC = 1/3). Each stock is described in the following table: Stock Beta Standard Deviation A 0.5 B 1.0 с 2.0 23% 38% 45% Expected Return 7.5% 12.0% 14.0% An analyst has used market- and firm-specific information to generate expected return estimates for each stock. The analyst's expected return estimates may or may not equal the stocks' required returns. You've also determined that the risk-free rate [TRF] is 4%, and the market risk premium [RPM] is 5%. Given this information, use the following graph of the security market line (SML) to plot each stock's beta and expected return on the graph. (Note: Click on the points on the graph to see their coordinates.) RATE OF RETURN (Percent) 20 18 16 14 2 0 0 0.2 0.4 0.6 0.8 1.0 1.2 RISK (Beta) 1.4 1.6 1.8 2.0 Stock A A Stock B Stock C A stock is in equilibrium if its expected return its required return. In general, assume that markets and stocks are in equilibrium (or fairly valued), but sometimes investors have different opinions about a stock's prospects and may think that a stock is out of equilibrium (either undervalued or overvalued). Based on the analyst's expected return estimates, Stock A is , Stock B is Stock C is in equilibrium and fairly valued. and Wilson holds a portfolio that invests equally in three stocks (WA = WB = WC = 1/3). Each stock is described in the following table: Stock Beta Standard Deviation A 0.5 B 1.0 с 2.0 23% 38% 45% Expected Return 7.5% 12.0% 14.0% An analyst has used market- and firm-specific information to generate expected return estimates for each stock. The analyst's expected return estimates may or may not equal the stocks' required returns. You've also determined that the risk-free rate [TRF] is 4%, and the market risk premium [RPM] is 5%. Given this information, use the following graph of the security market line (SML) to plot each stock's beta and expected return on the graph. (Note: Click on the points on the graph to see their coordinates.) RATE OF RETURN (Percent) 20 18 16 14 2 0 0 0.2 0.4 0.6 0.8 1.0 1.2 RISK (Beta) 1.4 1.6 1.8 2.0 Stock A A Stock B Stock C A stock is in equilibrium if its expected return its required return. In general, assume that markets and stocks are in equilibrium (or fairly valued), but sometimes investors have different opinions about a stock's prospects and may think that a stock is out of equilibrium (either undervalued or overvalued). Based on the analyst's expected return estimates, Stock A is , Stock B is Stock C is in equilibrium and fairly valued. and
Expert Answer:
Answer rating: 100% (QA)
Answer Solution I A stock is in equilibrium if its required return equals it... View the full answer
Related Book For
Statistics for Management and Economics Abbreviated
ISBN: 978-1285869643
10th Edition
Authors: Gerald Keller
Posted Date:
Students also viewed these accounting questions
-
Is there enough evidence to conclude that people with vision problems (DISABLD2: Do you have a vision problem that prevents you from reading a newspaper even when wearing glasses or contacts: 1 =...
-
Is there enough evidence to conclude that the average American with children was less than 25 years old when his or her first child was born (AGEKDBRN)?
-
Is there enough evidence to conclude that the average household contains less than two adults (ADULTS)?
-
Solve each of the linear systems in Problems 13 through 20 to determine whether the critical point (0, 0) is stable, asymptotically stable, or unstable. Use a computer system or graphing calculator...
-
Given C = 100 + 0.8Y, M = 150 + 0.20Y, I = 100, and X = 350: (a) Determine YE algebraically. (b) Show the determination of YE graphically as in the top panel of Figure 17.3.
-
When tert-butyl bromide undergoes solvolysis in a mixture of methanol and water, the rate of solvolysis (measured by the rate at which bromide ions form in the mixture) increases when the percentage...
-
Fill in the Blank. Cepstrum can be defined as the power spectrum of the logarithm of the ______________ .
-
The board of directors of Cable Plus authorizes the issue of $7,000,000 of 6%, 20-year bonds payable. The semiannual interest dates are May 31 and November 30. The bonds are issued on May 31, 2014,...
-
FILA used new media and social media to help the sport of wrestling win its reinstatement in the Olympic Games. Along with new media, what traditional communication methods could an organization use...
-
The speed control of a high-speed train is represented by the system shown in Figure AP5.4 [17]. Determine the equation for steady-state error for K for a unit step input r(t). Consider the three...
-
Question 1 (10 Marks) It is global knowledge that liquidity and liquidity ratios and other major ratios are used by analysts to determine a company's solvency or insolvency and level of...
-
The average proportion defective is known to be 1%. What should the upper and lower control limits of a p-chart be if n = 25 and z = 3.0?
-
A mixture of benzene and monochlorobenzene is to be separated into almost pure products by distillation. Determine an appropriate operating pressure at the top of the tower.
-
If a production line has a cycle time of 90 seconds, how much can it produce in 8 hours?
-
List the steps of data wrangling and explain what is done in each step.
-
A production line must produce 1,500 units every 4 hours of operating time. What is its cycle time in seconds?
-
Design the circuit that make conversion from BCD code to Excess-3 code by using ROM. BCD a b c d 0 00 0 EXCESS-3 x Y zt 0 0 1 1 0 00 1 0 1 0 0 00100101 0 0 1 1 0 1 1 0 0100 0111 0 10 1 1 0 0 0...
-
Refer to Exercise 8.S.I. Construct a scatterplot of the data. Does the appearance of the scatterplot indicate that the pairing was effective? Explain. Exercise 8.S.I. A volunteer working at an animal...
-
In preparing to launch a new product, a marketing manager has determined the critical path for her department. The activities and the mean and variance of the completion time for each activity along...
-
For each of the following, determine the number of degrees of freedom assuming equal population variances and unequal population variances. a. n1 = 15, n2 = 15, s21 = 25, s22 = 15 b. n1 = 10, n2 =...
-
A computer dating service typically asks for various pieces of information such as height, weight, income, and so on. One such service requested the length of index fingers. The only plausible reason...
-
The following frequency distribution presents the amounts, in dollars, spent for Valentines Day gifts in a survey of 123 U.S. adults. a. Approximate the mean amount spent on Valentines Day gifts. b....
-
The personal income per capita of a state is the total income of all adults in the state, divided by the number of adults. The following table presents the personal income per capita (in thousands of...
-
The following frequency distribution presents the number of U.S. adults (in thousands) ages 25 to 74 who have earned a Bachelors degree in a recent year. a. Approximate the mean age. b. If the...
Study smarter with the SolutionInn App