

Question: The problem is solved on excel I just want the steps to the questions . Harry, owner of an automobile battery distributorship in Atlanta, Georgia,
The problem is solved on excel I just want the steps to the questions .
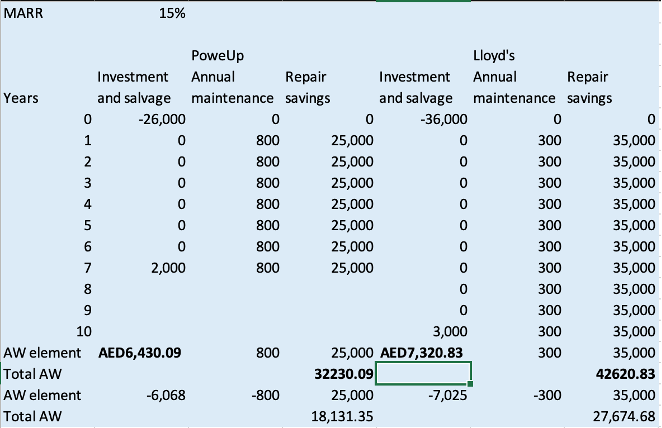
Harry, owner of an automobile battery distributorship in Atlanta, Georgia, performed an economic analysis 3 years ago when he decided to place surge protectors in-line for all his major pieces of testing equipment. The estimates used and the annual worth analysis at MARR = 15% are summarized below. Two different manufacturers protectors were compared.
|
| PowrUp | Lloyds |
| Cost and installation, $ | 26,000 | 36,000 |
| Annual maintenance cost, $ per year | 800 | 300 |
| Salvage value, $ | 2,000 | 3,000 |
| Equipment repair savings, $ | 25,000 | 35,000 |
| Useful life, years | 6 | 10 |
The spreadsheet in below sheet is the one Harry used to make the decision. Lloyds was the clear choice due to its substantially larger AW value. The Lloyds protectors were installed.
During a quick review this last year (year 3 of operation), it was obvious that the maintenance costs and repair savings have not followed (and will not follow) the estimates made 3 years ago. In fact, the maintenance contract cost (which includes quarterly inspection) is going from $300 to $1200 per year next year and will then increase 7% per year for the next 10 years. Also, the repair savings for the last 3 years were $29,205, $23,691, and $33,849, as best as Harry can determine. He believes savings will decrease by $3,153 per year hereafter. Finally, these 3-year-old protectors are worth nothing on the market now, so the salvage in 7 years is zero, not $3000.
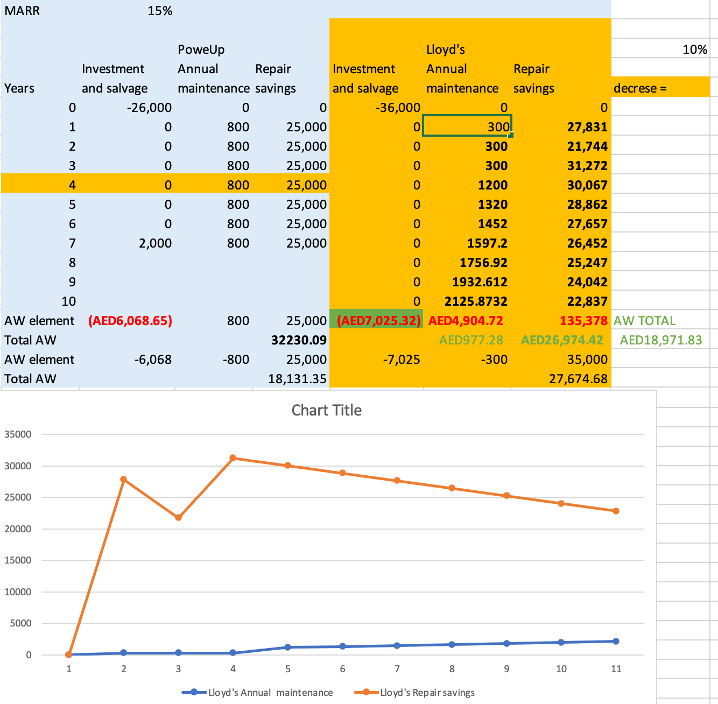
Q2-What is the recalculated AW ? show the steps using p=P0+F1(P/F,15%,1)+F2(P/F,15%,2)+,,,,,,,,,,,,,,
Q3- If these estimates had been made 3 years ago, would Lloyds still have been the economic choice? In other words when you calculated the new AW is it greater or less than AW powerup ?
Q4- How has the capital recovery amount changed for the Lloyds protectors with these new estimates?
MARR 15% Nm 0 0 PoweUp Lloyd's Investment Annual Repair Investment Annual Repair Years and salvage maintenance savings and salvage maintenance savings o -26,000 0 0 -36,000 0 0 1 0 800 25,000 0 300 35,000 2 0 800 25,000 0 300 35,000 3 0 800 25,000 300 35,000 4 0 800 25,000 0 300 35,000 5 0 800 25,000 300 35,000 6 0 800 25,000 0 300 35,000 7 2,000 800 25,000 0 300 35,000 8 0 300 35,000 9 0 300 35,000 10 3,000 300 35,000 AW element AED6,430.09 800 25,000 AED7,320.83 300 35,000 Total AW 32230.09 42620.83 AW element -6,068 -800 25,000 -7,025 -300 35,000 Total AW 18,131.35 27,674.68 MARR 15% PoweUp Lloyd's 10% Investment Annual Repair Investment Annual Repair Years and salvage maintenance savings and salvage maintenance savings decrese = o -26,000 0 0 -36,000 0 0 1 0 800 25,000 0 3001 27,831 2 0 800 25,000 0 300 21,744 3 0 800 25,000 0 300 31,272 4 0 800 25,000 0 1200 30,067 5 0 800 25,000 0 1320 28,862 6 0 800 25,000 0 1452 27,657 7 2,000 800 25,000 0 1597.2 26,452 8 0 1756.92 25,247 9 0 1932.612 24,042 10 0 2125.8732 22,837 AW element (AED6,068.65) 800 25,000 (AED7,025.32) AED4,904.72 135,378 AW TOTAL Total AW 32230.09 AED977.28 AED26,974.42 AED18,971.83 AW element -6,068 -800 25,000 -7,025 -300 35,000 Total AW 18,131.35 27,674.68 Chart Title 35000 30000 25000 20000 15000 10000 5000 0 1 2 3 4 5 6 7 8 9 10 11 Lloyd's Annual maintenance Lloyd's Repair savings MARR 15% Nm 0 0 PoweUp Lloyd's Investment Annual Repair Investment Annual Repair Years and salvage maintenance savings and salvage maintenance savings o -26,000 0 0 -36,000 0 0 1 0 800 25,000 0 300 35,000 2 0 800 25,000 0 300 35,000 3 0 800 25,000 300 35,000 4 0 800 25,000 0 300 35,000 5 0 800 25,000 300 35,000 6 0 800 25,000 0 300 35,000 7 2,000 800 25,000 0 300 35,000 8 0 300 35,000 9 0 300 35,000 10 3,000 300 35,000 AW element AED6,430.09 800 25,000 AED7,320.83 300 35,000 Total AW 32230.09 42620.83 AW element -6,068 -800 25,000 -7,025 -300 35,000 Total AW 18,131.35 27,674.68 MARR 15% PoweUp Lloyd's 10% Investment Annual Repair Investment Annual Repair Years and salvage maintenance savings and salvage maintenance savings decrese = o -26,000 0 0 -36,000 0 0 1 0 800 25,000 0 3001 27,831 2 0 800 25,000 0 300 21,744 3 0 800 25,000 0 300 31,272 4 0 800 25,000 0 1200 30,067 5 0 800 25,000 0 1320 28,862 6 0 800 25,000 0 1452 27,657 7 2,000 800 25,000 0 1597.2 26,452 8 0 1756.92 25,247 9 0 1932.612 24,042 10 0 2125.8732 22,837 AW element (AED6,068.65) 800 25,000 (AED7,025.32) AED4,904.72 135,378 AW TOTAL Total AW 32230.09 AED977.28 AED26,974.42 AED18,971.83 AW element -6,068 -800 25,000 -7,025 -300 35,000 Total AW 18,131.35 27,674.68 Chart Title 35000 30000 25000 20000 15000 10000 5000 0 1 2 3 4 5 6 7 8 9 10 11 Lloyd's Annual maintenance Lloyd's Repair savings
Step by Step Solution
There are 3 Steps involved in it

Get step-by-step solutions from verified subject matter experts