

The production cost benchmarks reported on p. 6 of each issue of the Footwear Industry Report...
Fantastic news! We've Found the answer you've been seeking!
Question:
Transcribed Image Text:
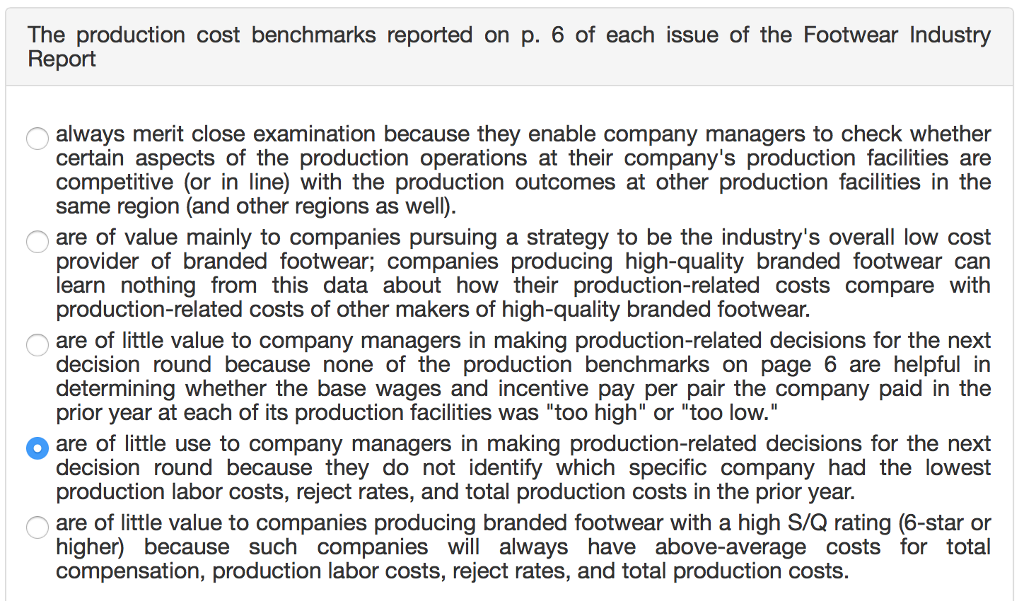
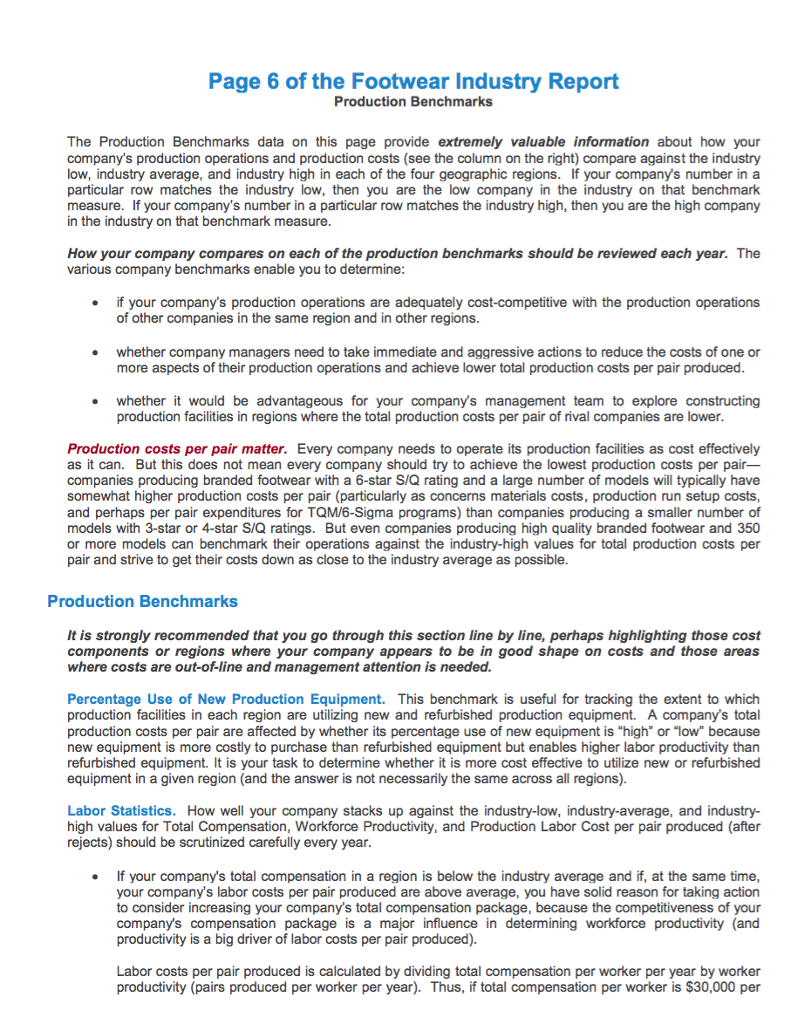
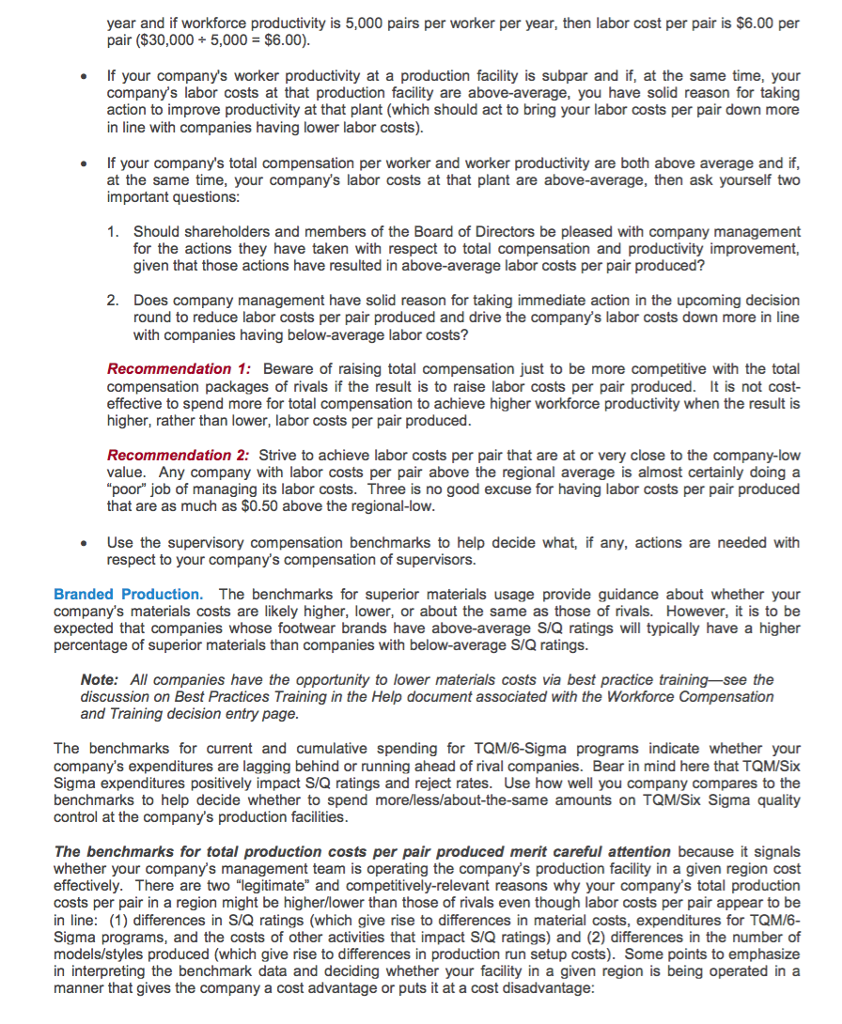
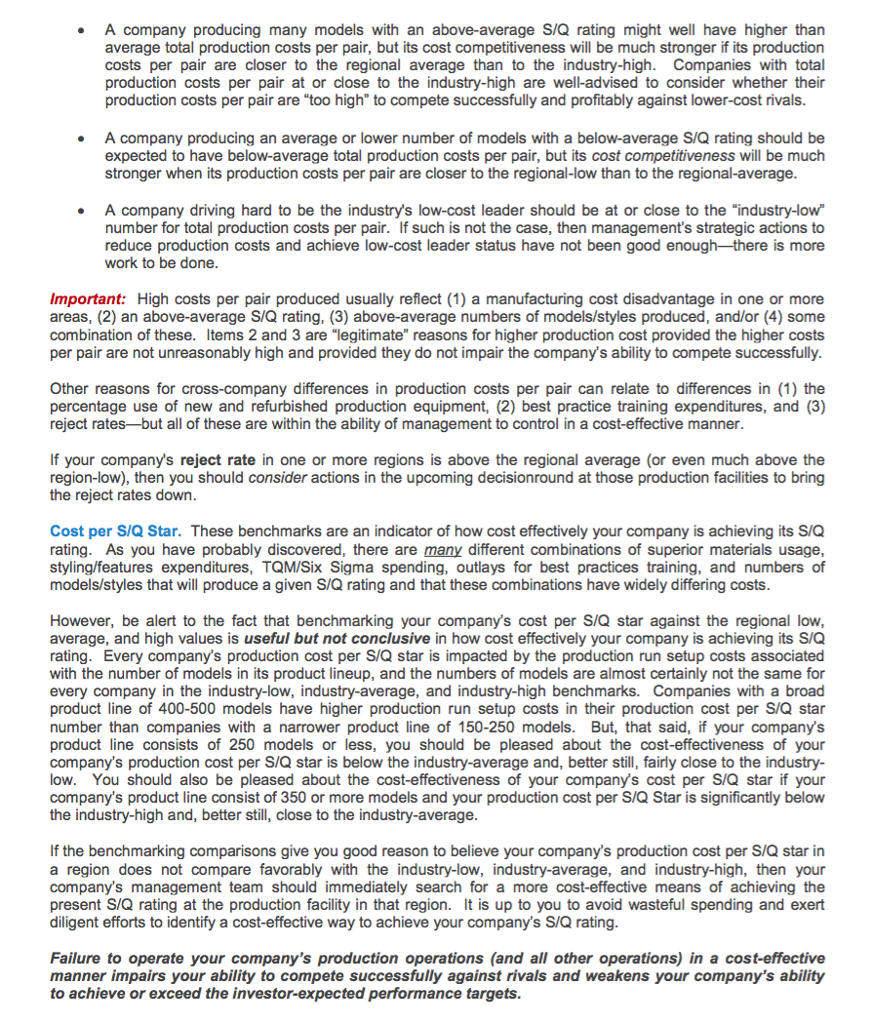
The production cost benchmarks reported on p. 6 of each issue of the Footwear Industry Report always merit close examination because they enable company managers to check whether certain aspects of the production operations at their company's production facilities are competitive (or in line) with the production outcomes at other production facilities in the same region (and other regions as well). are of value mainly to companies pursuing a strategy to be the industry's overall low cost provider of branded footwear; companies producing high-quality branded footwear can learn nothing from this data about how their production-related costs compare with production-related costs of other makers of high-quality branded footwear. are of little value to company managers in making production-related decisions for the next decision round because none of the production benchmarks on page 6 are helpful in determining whether the base wages and incentive pay per pair the company paid in the prior year at each of its production facilities was "too high" or "too low." are of little use to company managers in making production-related decisions for the next decision round because they do not identify which specific company had the lowest production labor costs, reject rates, and total production costs in the prior year. are of little value to companies producing branded footwear with a high S/Q rating (6-star or higher) because such companies will always have above-average costs for total compensation, production labor costs, reject rates, and total production costs. Page 6 of the Footwear Industry Report Production Benchmarks The Production Benchmarks data on this page provide extremely valuable information about how your company's production operations and production costs (see the column on the right) compare against the industry low, industry average, and industry high in each of the four geographic regions. If your company's number in a particular row matches the industry low, then you are the low company in the industry on that benchmark measure. If your company's number in a particular row matches the industry high, then you are the high company in the industry on that benchmark measure. How your company compares on each of the production benchmarks should be reviewed each year. The various company benchmarks enable you to determine: if your company's production operations are adequately cost-competitive with the production operations of other companies in the same region and in other regions. whether company managers need to take immediate and aggressive actions to reduce the costs of one or more aspects of their production operations and achieve lower total production costs per pair produced. whether would be advantageous for your company's management team to explore constructing production facilities in regions where the total production costs per pair f rival companies are lower. Production costs per pair matter. Every company needs to operate its production facilities as cost effectively as it can. But this does not mean every company should try to achieve the lowest production costs per pair- companies producing branded footwear with a 6-star S/Q rating and a large number of models will typically have somewhat higher production costs per pair (particularly as concerns materials costs, production run setup costs, and perhaps per pair expenditures for TQM/6-Sigma programs) than companies producing a smaller number of models with 3-star or 4-star S/Q ratings. But even companies producing high quality branded footwear and 350 or more models can benchmark their operations against the industry-high values for total production costs per pair and strive to get their costs down as close to the industry average as possible. Production Benchmarks It is strongly recommended that you go through this section line by line, perhaps highlighting those cost components or regions where your company appears to be in good shape on costs and those areas where costs are out-of-line and management attention is needed. ● Percentage Use of New Production Equipment. This benchmark is useful for tracking the extent to which production facilities in each region are utilizing new and refurbished production equipment. A company's total production costs per pair are affected by whether its percentage use of new equipment is "high" or "low" because new equipment is more costly to purchase than refurbished equipment but enables higher labor productivity than refurbished equipment. It is your task to determine whether it is more cost effective to utilize new or refurbished equipment in a given region (and the answer is not necessarily the same across all regions). Labor Statistics. How well your company stacks up against the industry-low, industry-average, and industry- high values for Total Compensation, Workforce Productivity, and Production Labor Cost per pair produced (after rejects) should be scrutinized carefully every year. your company's total compensation in a region is below the industry average and if, at the same time, your company's labor costs per pair produced are above average, you have solid reason for taking action to consider increasing your company's total compensation package, because the competitiveness of your company's compensation package is a major influence in determining workforce productivity (and productivity is a big driver of labor costs per pair produced). Labor costs per pair produced is calculated by dividing total compensation per worker per year by worker productivity (pairs produced per worker per year). Thus, if total compensation per worker is $30,000 per . year and if workforce productivity is 5,000 pairs per worker per year, then labor cost per pair is $6.00 per pair ($30,000 + 5,000 = $6.00). If your company's worker productivity at a production facility is subpar and if, at the same time, your company's labor costs at that production facility are above-average, you have solid reason for taking action to improve productivity at that plant (which should act to bring your labor costs per pair down more in line with companies having lower labor costs). If your company's total compensation per worker and worker productivity are both above average and if, at the same time, your company's labor costs at that plant are above-average, then ask yourself two important questions: 1. Should shareholders and members of the Board of Directors be pleased with company management for the actions they have taken with respect to total compensation and productivity improvement, given that those actions have resulted in above-average labor costs per pair produced? 2. Does company management have solid reason for taking immediate action in the upcoming decision round to reduce labor costs per pair produced and drive the company's labor costs down more in line with companies having below-average labor costs? Recommendation 1: Beware of raising total compensation just to be more competitive with the total compensation packages of rivals if the result is to raise labor costs per pair produced. It is not cost- effective to spend more for total compensation to achieve higher workforce productivity when the result is higher, rather than lower, labor costs per pair produced. Recommendation 2: Strive to achieve labor costs per pair that are at or very close to the company-low value. Any company with labor costs per pair above the regional average is almost certainly doing a "poor" job of managing its labor costs. Three is no good excuse for having labor costs per pair produced that are as much as $0.50 above the regional-low. ● Use the supervisory compensation benchmarks to help decide what, if any, actions are needed with respect to your company's compensation of supervisors. Branded Production. The benchmarks for superior materials usage provide guidance about whether your company's materials costs are likely higher, lower, or about the same as those of rivals. However, it is to be expected that companies whose footwear brands have above-average S/Q ratings will typically have a higher percentage of superior materials than companies with below-average S/Q ratings. Note: All companies have the opportunity to lower materials costs via best practice training-see the discussion on Best Practices Training the Help document associated with the Workforce Compensation and Training decision entry page. The benchmarks for current and cumulative spending for TQM/6-Sigma programs indicate whether your company's expenditures are lagging behind or running ahead of rival companies. Bear in mind here that TQM/Six Sigma expenditures positively impact S/Q ratings and reject rates. Use how well you company compares to the benchmarks to help decide whether to spend more/less/about-the-same amounts on TQM/Six Sigma quality control at the company's production facilities. The benchmarks for total production costs per pair produced merit careful attention because it signals whether your company's management team is operating the company's production facility in a given region cost effectively. There are two "legitimate" and competitively-relevant reasons why your company's total production costs per pair in a region might be higher/lower than those of rivals even though labor costs per pair appear to be in line: (1) differences in S/Q ratings (which give rise to differences in material costs, expenditures for TQM/6- Sigma programs, and the costs of other activities that impact S/Q ratings) and (2) differences in the number of models/styles produced (which give rise to differences in production run setup costs). Some points to emphasize in interpreting the benchmark data and deciding whether your facility in a given region is being operated in a manner that gives the company a cost advantage or puts it at a cost disadvantage: ● A company producing many models with an above-average S/Q rating might well have higher than average total production costs per pair, but its cost competitiveness will be much stronger if its production costs per pair are closer to the regional average than to the industry-high. Companies with total production costs per pair at or close to the industry-high are well-advised to consider whether their production costs per pair are "too high" to compete successfully and profitably against lower-cost rivals. A company producing an average or lower number of models with a below-average S/Q rating should be expected to have below-average total production costs per pair, but its cost competitiveness will be much stronger when its production costs per pair are closer to the regional-low than to the regional-average. A company driving hard to be the industry's low-cost leader should be at or close to the "industry-low" number for total production costs per pair. If such is not the case, then management's strategic actions to reduce production costs and achieve low-cost leader status have not been good enough-there is more work to be done. Important: High costs per pair produced usually reflect (1) a manufacturing cost disadvantage in one or more areas, (2) an above-average S/Q rating, (3) above-average numbers of models/styles produced, and/or (4) some combination of these. Items 2 and 3 are "legitimate" reasons for higher production cost provided the higher costs per pair are not unreasonably high and provided they do not impair the company's ability to compete successfully. Other reasons for cross-company differences in production costs per pair can relate to differences in (1) the percentage use of new and refurbished production equipment, (2) best practice training expenditures, and (3) reject rates-but all of these are within the ability of management to control in a cost-effective manner. If your company's reject rate in one or more regions is above the regional average (or even much above the region-low), then you should consider actions in the upcoming decisionround at those production facilities to bring the reject rates down. Cost per S/Q Star. These benchmarks are an indicator of how cost effectively your company is achieving its S/Q rating. As you have probably discovered, there are many different combinations of superior materials usage, styling/features expenditures, TQM/Six Sigma spending, outlays for best practices training, and numbers of models/styles that will produce a given S/Q rating and that these combinations have widely differing costs. However, be alert to the fact that benchmarking your company's cost per S/Q star against the regional low, average, and high values is useful but not conclusive in how cost effectively your company is achieving its S/Q rating. Every company's production cost per S/Q star is impacted by the production run setup costs associated with the number of models in its product lineup, and the numbers of models are almost certainly not the same for every company in the industry-low, industry-average, and industry-high benchmarks. Companies with a broad product line of 400-500 models have higher production run setup costs in their production cost per S/Q star number than companies with a narrower product line of 150-250 models. But, that said, if your company's product line consists of 250 models or less, you should be pleased about the cost-effectiveness of your company's production cost per S/Q star is below the industry-average and, better still, fairly close to the industry- low. You should also be pleased about the cost-effectiveness of your company's cost per S/Q star if your company's product line consist of 350 or more models and your production cost per S/Q Star is significantly below the industry-high and, better still, close to the industry-average. If the benchmarking comparisons give you good reason to believe your company's production cost per S/Q star in a region does not compare favorably with the industry-low, industry-average, and industry-high, then your company's management team should immediately search for a more cost-effective means of achieving the present S/Q rating at the production facility in that region. It is up to you to avoid wasteful spending and exert diligent efforts to identify a cost-effective way to achieve your company's S/Q rating. Failure to operate your company's production operations (and all other operations) in a cost-effective manner impairs your ability to compete successfully against rivals and weakens your company's ability to achieve or exceed the investor-expected performance targets. The production cost benchmarks reported on p. 6 of each issue of the Footwear Industry Report always merit close examination because they enable company managers to check whether certain aspects of the production operations at their company's production facilities are competitive (or in line) with the production outcomes at other production facilities in the same region (and other regions as well). are of value mainly to companies pursuing a strategy to be the industry's overall low cost provider of branded footwear; companies producing high-quality branded footwear can learn nothing from this data about how their production-related costs compare with production-related costs of other makers of high-quality branded footwear. are of little value to company managers in making production-related decisions for the next decision round because none of the production benchmarks on page 6 are helpful in determining whether the base wages and incentive pay per pair the company paid in the prior year at each of its production facilities was "too high" or "too low." are of little use to company managers in making production-related decisions for the next decision round because they do not identify which specific company had the lowest production labor costs, reject rates, and total production costs in the prior year. are of little value to companies producing branded footwear with a high S/Q rating (6-star or higher) because such companies will always have above-average costs for total compensation, production labor costs, reject rates, and total production costs. Page 6 of the Footwear Industry Report Production Benchmarks The Production Benchmarks data on this page provide extremely valuable information about how your company's production operations and production costs (see the column on the right) compare against the industry low, industry average, and industry high in each of the four geographic regions. If your company's number in a particular row matches the industry low, then you are the low company in the industry on that benchmark measure. If your company's number in a particular row matches the industry high, then you are the high company in the industry on that benchmark measure. How your company compares on each of the production benchmarks should be reviewed each year. The various company benchmarks enable you to determine: if your company's production operations are adequately cost-competitive with the production operations of other companies in the same region and in other regions. whether company managers need to take immediate and aggressive actions to reduce the costs of one or more aspects of their production operations and achieve lower total production costs per pair produced. whether would be advantageous for your company's management team to explore constructing production facilities in regions where the total production costs per pair f rival companies are lower. Production costs per pair matter. Every company needs to operate its production facilities as cost effectively as it can. But this does not mean every company should try to achieve the lowest production costs per pair- companies producing branded footwear with a 6-star S/Q rating and a large number of models will typically have somewhat higher production costs per pair (particularly as concerns materials costs, production run setup costs, and perhaps per pair expenditures for TQM/6-Sigma programs) than companies producing a smaller number of models with 3-star or 4-star S/Q ratings. But even companies producing high quality branded footwear and 350 or more models can benchmark their operations against the industry-high values for total production costs per pair and strive to get their costs down as close to the industry average as possible. Production Benchmarks It is strongly recommended that you go through this section line by line, perhaps highlighting those cost components or regions where your company appears to be in good shape on costs and those areas where costs are out-of-line and management attention is needed. ● Percentage Use of New Production Equipment. This benchmark is useful for tracking the extent to which production facilities in each region are utilizing new and refurbished production equipment. A company's total production costs per pair are affected by whether its percentage use of new equipment is "high" or "low" because new equipment is more costly to purchase than refurbished equipment but enables higher labor productivity than refurbished equipment. It is your task to determine whether it is more cost effective to utilize new or refurbished equipment in a given region (and the answer is not necessarily the same across all regions). Labor Statistics. How well your company stacks up against the industry-low, industry-average, and industry- high values for Total Compensation, Workforce Productivity, and Production Labor Cost per pair produced (after rejects) should be scrutinized carefully every year. your company's total compensation in a region is below the industry average and if, at the same time, your company's labor costs per pair produced are above average, you have solid reason for taking action to consider increasing your company's total compensation package, because the competitiveness of your company's compensation package is a major influence in determining workforce productivity (and productivity is a big driver of labor costs per pair produced). Labor costs per pair produced is calculated by dividing total compensation per worker per year by worker productivity (pairs produced per worker per year). Thus, if total compensation per worker is $30,000 per . year and if workforce productivity is 5,000 pairs per worker per year, then labor cost per pair is $6.00 per pair ($30,000 + 5,000 = $6.00). If your company's worker productivity at a production facility is subpar and if, at the same time, your company's labor costs at that production facility are above-average, you have solid reason for taking action to improve productivity at that plant (which should act to bring your labor costs per pair down more in line with companies having lower labor costs). If your company's total compensation per worker and worker productivity are both above average and if, at the same time, your company's labor costs at that plant are above-average, then ask yourself two important questions: 1. Should shareholders and members of the Board of Directors be pleased with company management for the actions they have taken with respect to total compensation and productivity improvement, given that those actions have resulted in above-average labor costs per pair produced? 2. Does company management have solid reason for taking immediate action in the upcoming decision round to reduce labor costs per pair produced and drive the company's labor costs down more in line with companies having below-average labor costs? Recommendation 1: Beware of raising total compensation just to be more competitive with the total compensation packages of rivals if the result is to raise labor costs per pair produced. It is not cost- effective to spend more for total compensation to achieve higher workforce productivity when the result is higher, rather than lower, labor costs per pair produced. Recommendation 2: Strive to achieve labor costs per pair that are at or very close to the company-low value. Any company with labor costs per pair above the regional average is almost certainly doing a "poor" job of managing its labor costs. Three is no good excuse for having labor costs per pair produced that are as much as $0.50 above the regional-low. ● Use the supervisory compensation benchmarks to help decide what, if any, actions are needed with respect to your company's compensation of supervisors. Branded Production. The benchmarks for superior materials usage provide guidance about whether your company's materials costs are likely higher, lower, or about the same as those of rivals. However, it is to be expected that companies whose footwear brands have above-average S/Q ratings will typically have a higher percentage of superior materials than companies with below-average S/Q ratings. Note: All companies have the opportunity to lower materials costs via best practice training-see the discussion on Best Practices Training the Help document associated with the Workforce Compensation and Training decision entry page. The benchmarks for current and cumulative spending for TQM/6-Sigma programs indicate whether your company's expenditures are lagging behind or running ahead of rival companies. Bear in mind here that TQM/Six Sigma expenditures positively impact S/Q ratings and reject rates. Use how well you company compares to the benchmarks to help decide whether to spend more/less/about-the-same amounts on TQM/Six Sigma quality control at the company's production facilities. The benchmarks for total production costs per pair produced merit careful attention because it signals whether your company's management team is operating the company's production facility in a given region cost effectively. There are two "legitimate" and competitively-relevant reasons why your company's total production costs per pair in a region might be higher/lower than those of rivals even though labor costs per pair appear to be in line: (1) differences in S/Q ratings (which give rise to differences in material costs, expenditures for TQM/6- Sigma programs, and the costs of other activities that impact S/Q ratings) and (2) differences in the number of models/styles produced (which give rise to differences in production run setup costs). Some points to emphasize in interpreting the benchmark data and deciding whether your facility in a given region is being operated in a manner that gives the company a cost advantage or puts it at a cost disadvantage: ● A company producing many models with an above-average S/Q rating might well have higher than average total production costs per pair, but its cost competitiveness will be much stronger if its production costs per pair are closer to the regional average than to the industry-high. Companies with total production costs per pair at or close to the industry-high are well-advised to consider whether their production costs per pair are "too high" to compete successfully and profitably against lower-cost rivals. A company producing an average or lower number of models with a below-average S/Q rating should be expected to have below-average total production costs per pair, but its cost competitiveness will be much stronger when its production costs per pair are closer to the regional-low than to the regional-average. A company driving hard to be the industry's low-cost leader should be at or close to the "industry-low" number for total production costs per pair. If such is not the case, then management's strategic actions to reduce production costs and achieve low-cost leader status have not been good enough-there is more work to be done. Important: High costs per pair produced usually reflect (1) a manufacturing cost disadvantage in one or more areas, (2) an above-average S/Q rating, (3) above-average numbers of models/styles produced, and/or (4) some combination of these. Items 2 and 3 are "legitimate" reasons for higher production cost provided the higher costs per pair are not unreasonably high and provided they do not impair the company's ability to compete successfully. Other reasons for cross-company differences in production costs per pair can relate to differences in (1) the percentage use of new and refurbished production equipment, (2) best practice training expenditures, and (3) reject rates-but all of these are within the ability of management to control in a cost-effective manner. If your company's reject rate in one or more regions is above the regional average (or even much above the region-low), then you should consider actions in the upcoming decisionround at those production facilities to bring the reject rates down. Cost per S/Q Star. These benchmarks are an indicator of how cost effectively your company is achieving its S/Q rating. As you have probably discovered, there are many different combinations of superior materials usage, styling/features expenditures, TQM/Six Sigma spending, outlays for best practices training, and numbers of models/styles that will produce a given S/Q rating and that these combinations have widely differing costs. However, be alert to the fact that benchmarking your company's cost per S/Q star against the regional low, average, and high values is useful but not conclusive in how cost effectively your company is achieving its S/Q rating. Every company's production cost per S/Q star is impacted by the production run setup costs associated with the number of models in its product lineup, and the numbers of models are almost certainly not the same for every company in the industry-low, industry-average, and industry-high benchmarks. Companies with a broad product line of 400-500 models have higher production run setup costs in their production cost per S/Q star number than companies with a narrower product line of 150-250 models. But, that said, if your company's product line consists of 250 models or less, you should be pleased about the cost-effectiveness of your company's production cost per S/Q star is below the industry-average and, better still, fairly close to the industry- low. You should also be pleased about the cost-effectiveness of your company's cost per S/Q star if your company's product line consist of 350 or more models and your production cost per S/Q Star is significantly below the industry-high and, better still, close to the industry-average. If the benchmarking comparisons give you good reason to believe your company's production cost per S/Q star in a region does not compare favorably with the industry-low, industry-average, and industry-high, then your company's management team should immediately search for a more cost-effective means of achieving the present S/Q rating at the production facility in that region. It is up to you to avoid wasteful spending and exert diligent efforts to identify a cost-effective way to achieve your company's S/Q rating. Failure to operate your company's production operations (and all other operations) in a cost-effective manner impairs your ability to compete successfully against rivals and weakens your company's ability to achieve or exceed the investor-expected performance targets.
Expert Answer:
Answer rating: 100% (QA)
The detailed answer for the above question is provided below answer are of value mainly to companies pursuing a strategy to be the industrys overall low cost provider of branded footwear companies pro... View the full answer

Related Book For 

Income Tax Fundamentals 2013
ISBN: 9781285586618
31st Edition
Authors: Gerald E. Whittenburg, Martha Altus Buller, Steven L Gill
Posted Date:
Students also viewed these general management questions
-
How can too little group cohesiveness result in low levels of performance?
-
Can managers be too satisfied with their job? Can they be too committed to their organizations? Why or why not?
-
How can companies pursuing cost leadership and differentiation lose their place on the value frontier? In what ways can companies regain their competitive advantage?
-
In Problems 1158, perform the indicated operation, and write each expression in the standard form a + bi. i 7 (1 + i 2 )
-
Explain the cost estimation problem caused by allocated and discretionary costs.
-
Identify the form of payment, form of acquisition, acquisition vehicle, and post-closing organization? Speculate why each may have been used.
-
How do you inhale?
-
Cole Pro Company managers received the following incomplete performance report: Complete the performance report. Identify the employee group that may deserve praise and the group that may be subject...
-
Recall that viscous incompressible unidirectional flow with velocity u = wk is governed by Iw t 1 (1) where z is the coordinate in the k direction, t is time, p is pressure, p is the density, v = p/p...
-
Alice Appliance Service had net income for the year of $58,500. In addition, the balance sheet reports the following balances: Calculate the return on assets for Alice Appliance Service for the year...
-
The International Organization for Standardization is an international (ISO) standard-setting body composed of representatives from various national standards organizations. Visit and investigate the...
-
The vertical speed of the wave Asin(x-wt) is 2 m/s at x=pi and t=0. The vertical acceleration when x-wt=pi/2 is -4 m/s^2. Find a and w.
-
What happens to the outer regions of a low-mass star like our Sun when fusion begins to shut down? a. It begins to contract and heat up b. It begins to contract and cool down c. It begins to expand...
-
____ is noise added to the signal in the wire from EMI generated by adjacent wires. a. Interference b. Crosstalk c. Crosswalk d. Coupling
-
When molecules absorb heat, there is an increase in A) the kinetic energy of the molecules. B) The potential energy of the molecules. C) The mass of the molecules. D) The bond energy of the molecules
-
Charges of -5.10 C and -3.60 4C are placed 3.00 cm apart as shown: 3.00 cm -5.104C Charge A 7 3.48 108 N/C 6.00 107 N/C 5.22' 106 N/C 8.99' 105 N/C P Charge B Refer to the above diagram. The...
-
As a CPA working in a pharma corporation, the president asks you to project the maximum price for the market for a newly acquired drug that was on the market for $5 a dose. Your job and bonus are...
-
What mass of KBr (in grams) should you use to make 350.0 mL of a 1.30 M KBr solution?
-
In 2012, Margaret and John Murphy are married taxpayers who file a joint tax return with AGl of $25,000. During the year they incurred the following expenses: Hospitalization insurance...
-
If Charles, a 16-year-old child model, earns $50,000 a year and is completely self supporting even though he lives with his parents, can his parents claim him as a dependent? Why or why not?...
-
Ann hires a nanny to watch her two children while she works at a local hospital. She pays the 19-year-old nanny $125 per week for 48 weeks during the current year. a. What is the employer's portion...
-
Compute the price of a share of stock that pays a \($5\) per year dividend and that you expect to be able to sell in one year for \($40\), assuming you require a 5% return.
-
You are considering purchasing a 10-year bond and follow the theory of rational expectations. If you have just read the annual report of the central bank in your country that states interest rates...
-
Suppose that you are a trader at the stock market. T-Mobiles stocks currently trade at $45 and the expected return is 9%. You have information that leads you to believe that by the end of year the...

Study smarter with the SolutionInn App