

Question: the PSPP output for the variable, Indicate how bad versus good you think later start times are for schools in LAUSD (after 9am) by choosing
the PSPP output for the variable, "Indicate how bad versus good you think later start times are for schools in LAUSD (after 9am) by choosing a number between 1 and 7."
Please answer the following questions using this output, labeling your answers with the correct letter (type in your answers). HINT: It is not necessary to calculate most of the values below, as they are printed and labeled on the output.
a. What is the valid sample size? Hint: do not include missing data.
b. What are the mean, median, and mode?
c. What are the variance and standard deviation
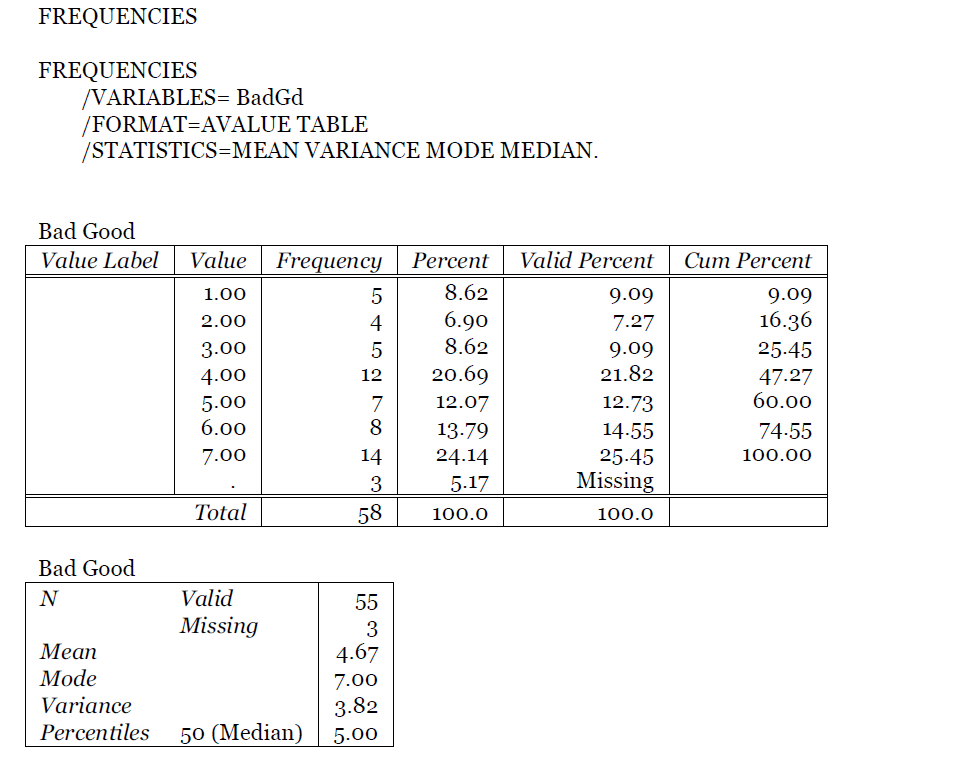
FREQUENCIES FREQUENCIES VARIABLES= BadGd /FORMAT=AVALUE TABLE /STATISTICS=MEAN VARIANCE MODE MEDIAN. Bad Good Value Label Value Frequency Percent Valid Percent Cum Percent 1.00 8.62 9.09 9.09 2.00 6.90 7.27 16.36 3.00 8.62 9.09 25-45 4.00 20.69 21.82 47.27 5.00 7 12.07 12.73 60.00 6.00 8 13.79 14.55 74-55 7.00 14 24.14 25-45 100.00 3 5.17 Missing Total 58 100.0 100.0 Bad Good N Valid 55 Missing 3 Mean 4.67 Mode 7.00 Variance 3.82 Percentiles 50 (Median) 5.00
Step by Step Solution
There are 3 Steps involved in it

Get step-by-step solutions from verified subject matter experts