

Question: The P-value on a regression output is .90 for the independent variable. Based on this value, briefly explain if this analysis can be used as
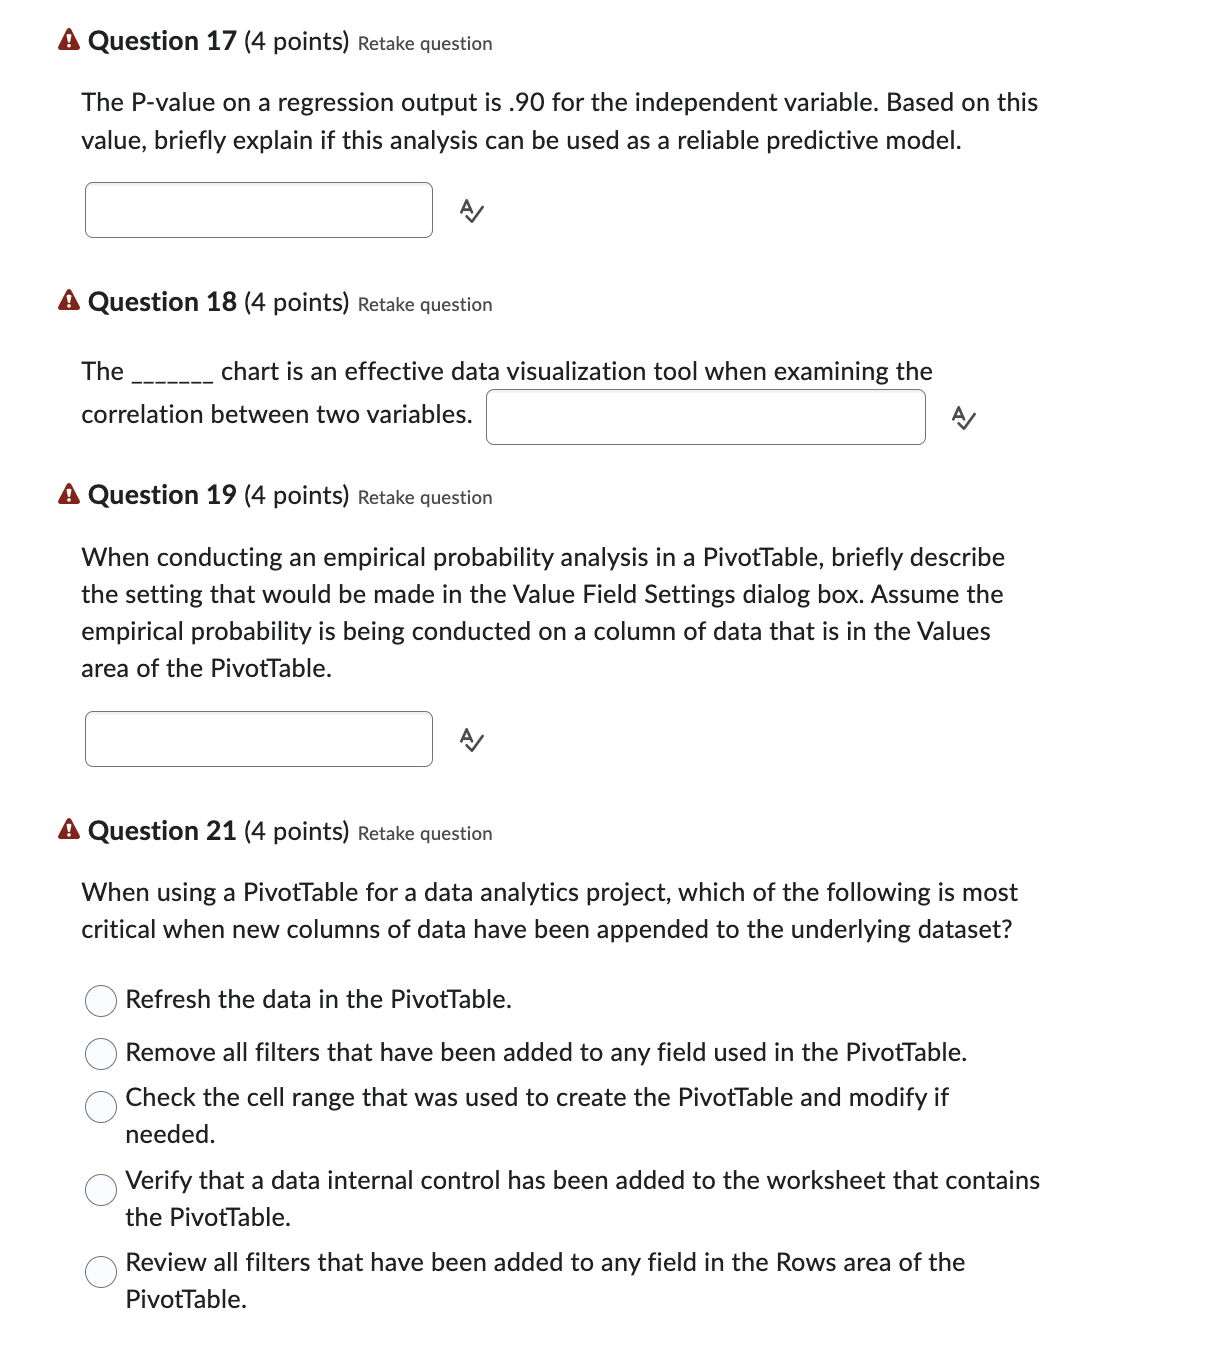
The P-value on a regression output is .90 for the independent variable. Based on this value, briefly explain if this analysis can be used as a reliable predictive model. A Question 18 (4 points) Retake question The chart is an effective data visualization tool when examining the correlation between two variables. A. A Question 19 (4 points) Retake question When conducting an empirical probability analysis in a PivotTable, briefly describe the setting that would be made in the Value Field Settings dialog box. Assume the empirical probability is being conducted on a column of data that is in the Values area of the PivotTable. Question 21 (4 points) Retake question When using a PivotTable for a data analytics project, which of the following is most critical when new columns of data have been appended to the underlying dataset? Refresh the data in the PivotTable. Remove all filters that have been added to any field used in the PivotTable. Check the cell range that was used to create the PivotTable and modify if needed. Verify that a data internal control has been added to the worksheet that contains the PivotTable. Review all filters that have been added to any field in the Rows area of the PivotTable
Step by Step Solution
There are 3 Steps involved in it

Get step-by-step solutions from verified subject matter experts