

Question: The Q-statistic is the answer to the question: Suppose that a person chose a flight completely at random from among the set of interest (e.g.,
The Q-statistic is the answer to the question: "Suppose that a person chose a flight completely at random from among the set of interest (e.g., scheduled UK domestic jet flights in the 1990s). What is the probability that he would not survive the flight?"
In this section, we are speaking of death in an aviation accident, and not from terrorism or natural causes. A flight is a non-stop trip; a journey that involves one intermediate stop would entail two flights. The Q-statistic - which is essentially death risk per flight - assumes that there are N flights that can be indexed as (1, 2, 3,. . .,N). We define Xi as the fraction of passengers on flight i who do not survive it. If the flight lands safely, then Xi=0; if it crashes and no one survives, then Xi=1; if it crashes and 20% of the passengers perish, then Wi=0.2.
To determine the Q-statistic, we note that each of the N flights has the same chance of 1/N of being selected at random. Given that flight i was selected, the traveler's conditional death risk is xi. One way of dying because of the "flight lottery" would be to choose flight 1 at random and then perish; the probability of this event is (1/N)X1. Another way would be to select flight 2 and perish, an event of probability (1/N)W2. The overall probability of dying would be the sum of the probabilities of all the N mutually exclusive ways that a fatal outcome can arise. In consequence, Q can be obtained under the formula:
Q=?Xi/N
For example, in the 1990s, there were a total of approximately 70 million domestic jet flights in the developed world. All but 10 of those flights landed without any accidental deaths; on the remaining 10, the average fraction of passengers killed was 56%. Therefore, the sum of the xi in the formula for Q (Equation (11.1)) was 10 0.56 = 5.6, and N ? 70 million. Q is therefore estimated as 5.6 70,000,000, which is approximately 1 in 13 million (70,000,000 5.6).
Using the following file containing data on 14 CFR 121 air carrier accidents from 1982 - to 2017. Calculate the Q-statistics for all years
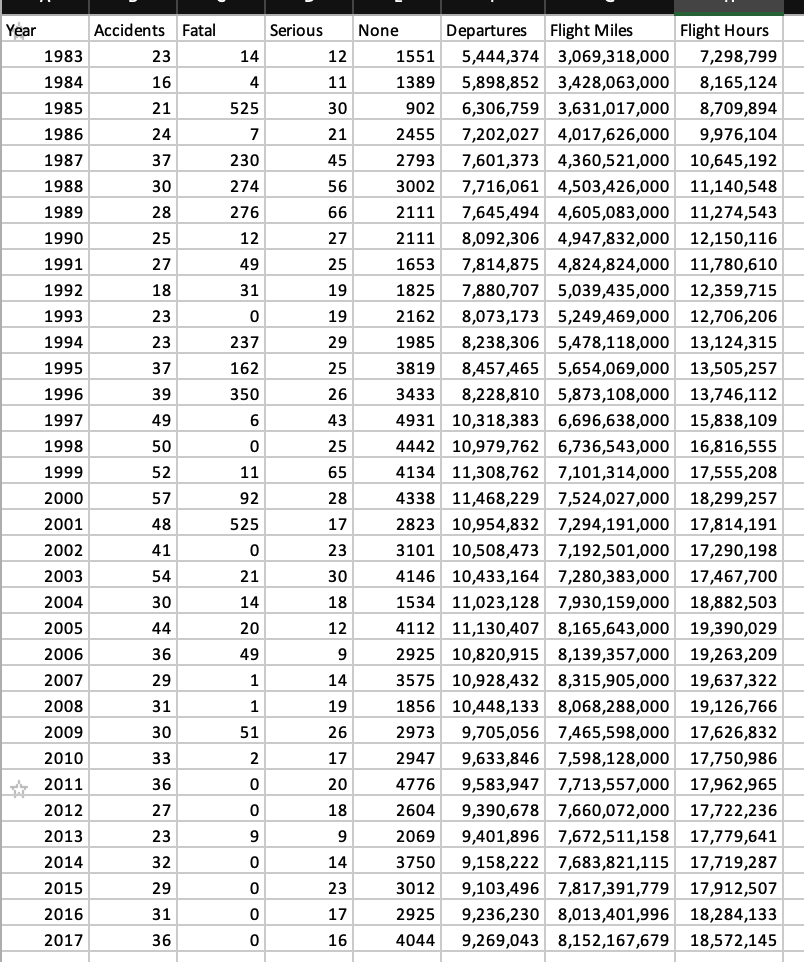
Year Accidents Fatal Serious None Departures Flight Miles Flight Hours 1983 23 14 12 1551 5,444,374 3,069,318,000 7,298,799 1984 16 4 11 1389 5,898,852 3,428,063,000 8,165,124 1985 21 525 30 902 6,306,759 3,631,017,000 8,709,894 1986 24 7 21 2455 7,202,027 4,017,626,000 9,976,104 1987 37 230 45 2793 7,601,373 4,360,521,000 10,645,192 1988 30 274 56 3002 7,716,061 4,503,426,000 11,140,548 1989 28 276 66 2111 7,645,494 4,605,083,000 11,274,543 1990 25 12 27 2111 8,092,306 4,947,832,000 12,150,116 1991 27 49 25 1653 7,814,875 4,824,824,000 11,780,610 1992 18 31 19 1825 7,880,707 5,039,435,000 12,359,715 1993 23 0 19 2162 8,073,173 5,249,469,000 12,706,206 1994 23 237 29 1985 8,238,306 5,478,118,000 13,124,315 1995 37 162 25 3819 8,457,465 5,654,069,000 13,505,257 1996 39 350 26 3433 8,228,810 5,873,108,000 13,746,112 1997 49 6 43 4931 10,318,383 6,696,638,000 15,838,109 1998 50 0 25 4442 10,979,762 6,736,543,000 16,816,555 1999 52 11 65 4134 11,308,762 7,101,314,000 17,555,208 2000 57 92 28 4338 11,468,229 7,524,027,000 18,299,257 2001 48 525 17 2823 10,954,832 7,294,191,000 17,814,191 2002 41 0 23 3101 10,508,473 7,192,501,000 17,290,198 2003 54 21 30 4146 10,433,164 7,280,383,000 17,467,700 2004 30 14 18 1534 11,023,128 7,930,159,000 18,882,503 2005 44 20 12 4112 11,130,407 8,165,643,000 19,390,029 2006 36 49 9 2925 10,820,915 8,139,357,000 19,263,209 2007 29 1 14 3575 10,928,432 8,315,905,000 19,637,322 2008 31 1 19 1856 10,448,133 8,068,288,000 19,126,766 2009 30 51 26 2973 9,705,056 7,465,598,000 17,626,832 2010 33 2 17 2947 9,633,846 7,598,128,000 17,750,986 2011 36 0 20 4776 9,583,947 7,713,557,000 17,962,965 2012 27 0 18 2604 9,390,678 7,660,072,000 17,722,236 2013 23 9 2069 9,401,896 7,672,511,158 17,779,641 2014 32 14 3750 9,158,222 7,683,821,115 17,719,287 2015 29 23 3012 9,103,496 7,817,391,779 17,912,507 2016 31 17 2925 9,236,230 8,013,401,996 18,284,133 2017 36 16 4044 9,269,043 8,152,167,679 18,572,145
Step by Step Solution
There are 3 Steps involved in it

Get step-by-step solutions from verified subject matter experts