

Question: The quality coordinator of a fertilizer factory randomly selected 4 samples of size 6 to determine if the filling process was in control or
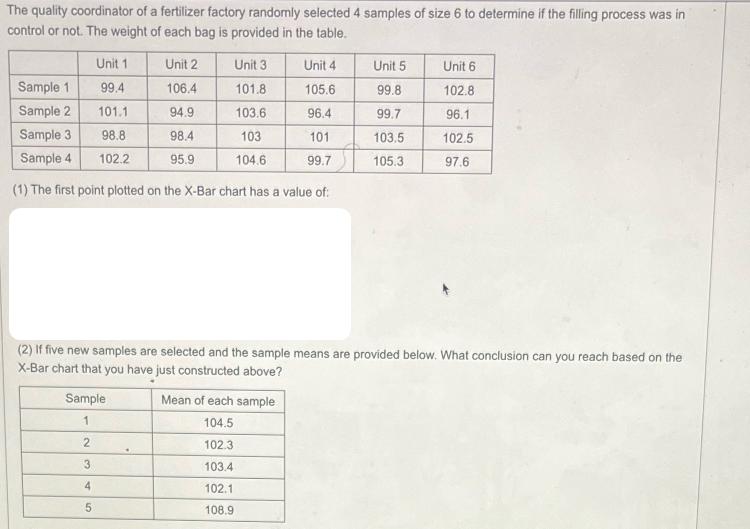
The quality coordinator of a fertilizer factory randomly selected 4 samples of size 6 to determine if the filling process was in control or not. The weight of each bag is provided in the table. Unit 1 99.4 101.1 98.8 102.2 Sample 1 2 3 4 Unit 2 106.4 94.9 98.4 95.9 Sample 1 Sample 2 Sample 3 Sample 4 (1) The first point plotted on the X-Bar chart has a value of: 5 Unit 3 101.8 103.6 103 104.6 Unit 4 105.6 96.4 101 99.7 (2) If five new samples are selected and the sample means are provided below. What conclusion can you reach based on the X-Bar chart that you have just constructed above? Mean of each sample 104.5 102.3 103.4 102.1 108.9 Unit 5 99.8 99.7 103.5 105.3 Unit 6 102.8 96.1 102.5 97.6
Step by Step Solution
3.36 Rating (149 Votes )
There are 3 Steps involved in it
To construct an XBar chart and answer the questions we need to calculate the sample means and the control limits Here are the steps 1 Calculate the sample means For each sample calculate the mean by s... View full answer

Get step-by-step solutions from verified subject matter experts