

The quarterly demand for costumes at a party supplies store is shown in the table below. Time
Question:
The quarterly demand for costumes at a party supplies store is shown in the table below.
| Time | Period | Demand |
| First-quarter, year 1 | 1 | 210 |
| Second-quarter, year 1 | 2 | 1700 |
| Third-quarter, year 1 | 3 | 3400 |
| Fourth-quarter, year 1 | 4 | 1400 |
| First-quarter, year 2 | 5 | 300 |
| Second-quarter, year 2 | 6 | 2000 |
| Third-quarter, year 2 | 7 | 3500 |
| Fourth-quarter, year 2 | 8 | 1800 |
| First-quarter, year 3 | 9 | 450 |
| Second quarter, year 3 | 10 | 2100 |
| Third quarter, year 3 | 11 | 3600 |
| Fourth quarter, year 3 | 12 | 2000 |
Conduct time-series demand forecasting in Excel and answer the following questions. 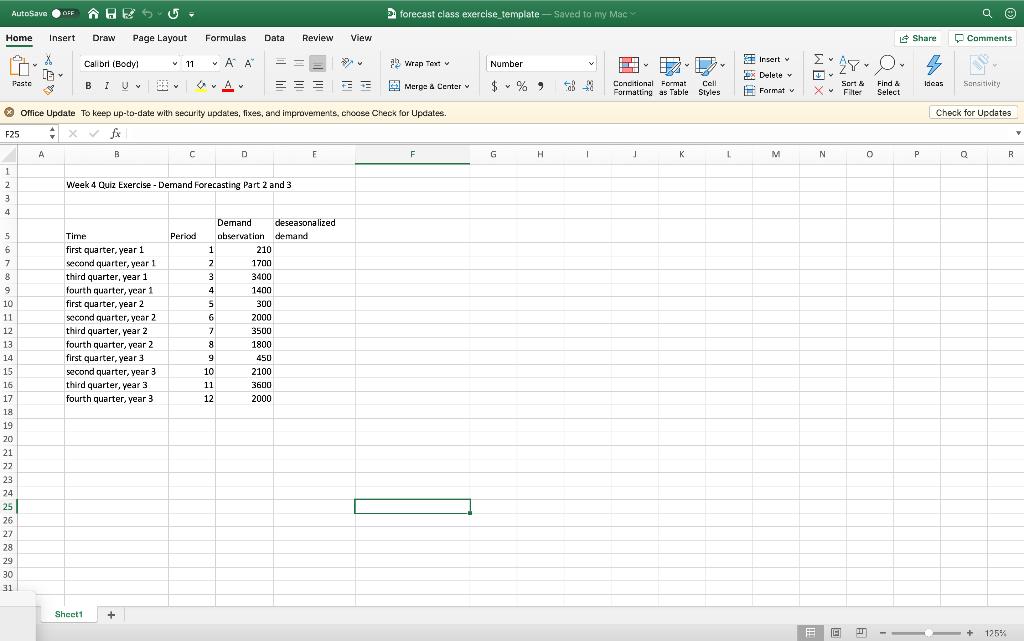
a) How can you calculate the deseasonalized demand for period 3? Write down the formula and show your calculations.
(For questions b-d, simply put down "see Excel for solutions" in the answer box below. Make sure that you clearly mark where these numbers are calculated in the Excel workbook.)
(b) Calculate the deseasonalized demand for periods 3-10 in Excel.
(c) Use the regression function in Excel to estimate the level and the trend factors.
(d) Estimate the seasonal factors in Excel.
(e) Based on your calculations, write down the formula of the systematic component of the demand forecast.
Expert Answer:
Time Period Demand Firstquarter year 1 1 210 Secondquarter year 1 2 1700 Thirdquarter year 1 3 3400 Fourthquarter year 1 4 1400 Firstquarter year 2 5 300 Secondquarter year 2 6 2000 Thirdquarter year ... View the full answer


Managerial Decision Modeling with Spreadsheets
ISBN: 978-0136115830
3rd edition
Authors: Nagraj Balakrishnan, Barry Render, Jr. Ralph M. Stair
