

Question: The quarterly sales data (number of copies sold) for a college textbook over the past three years follow. Click on the datafile logo to reference
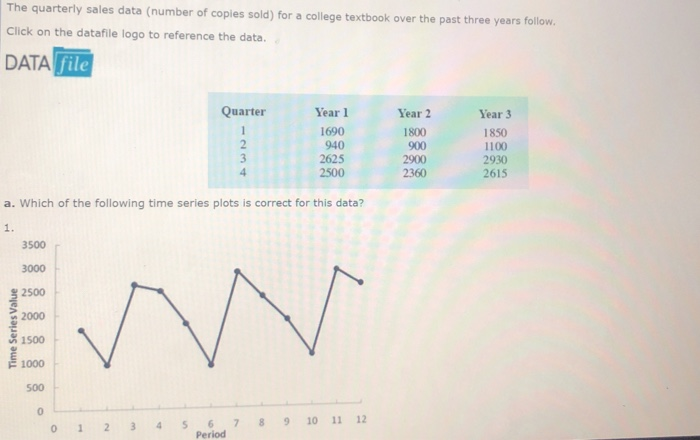
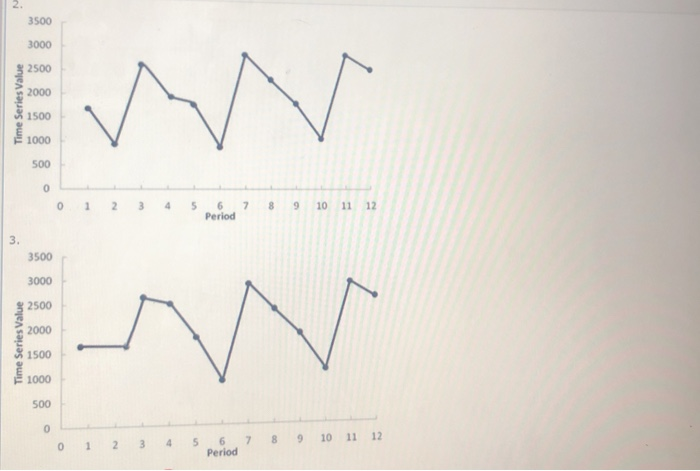
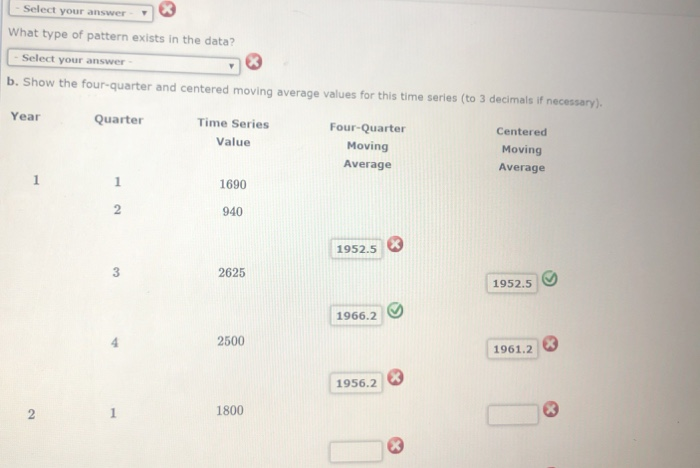
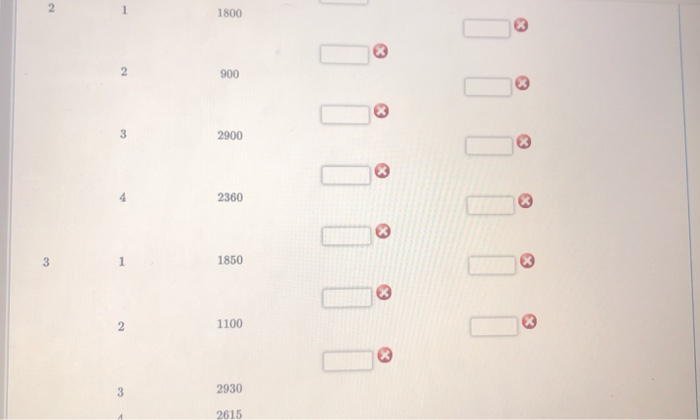
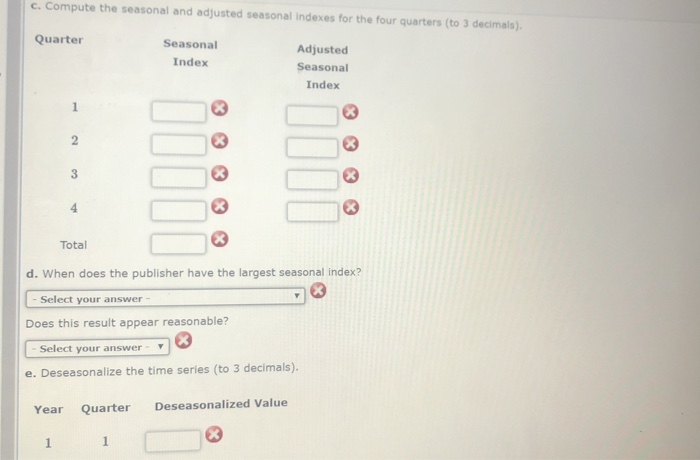
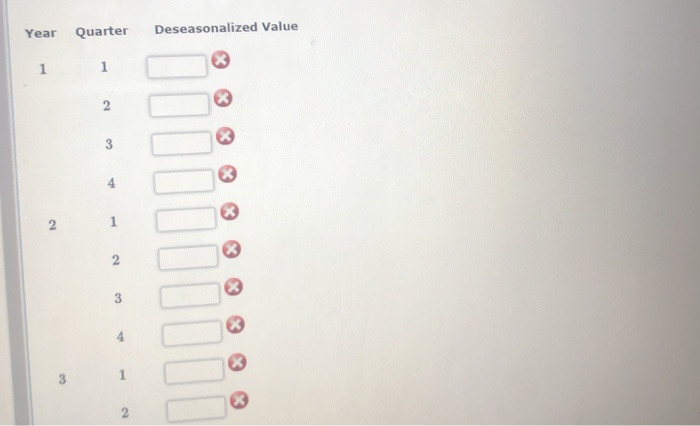
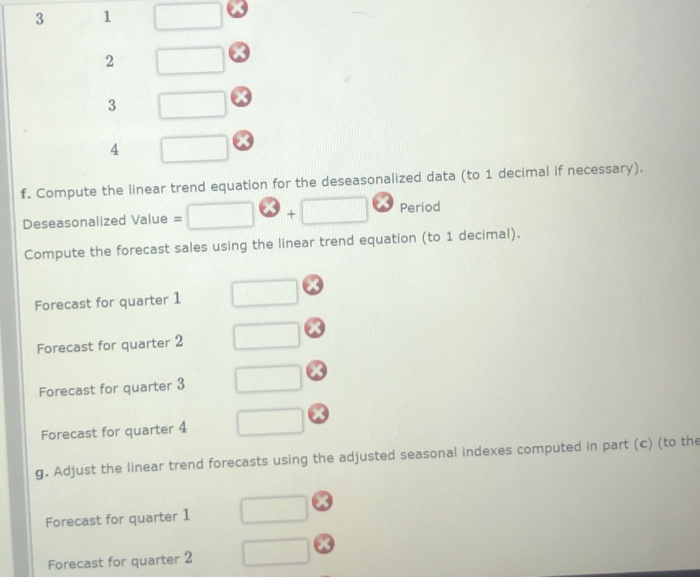
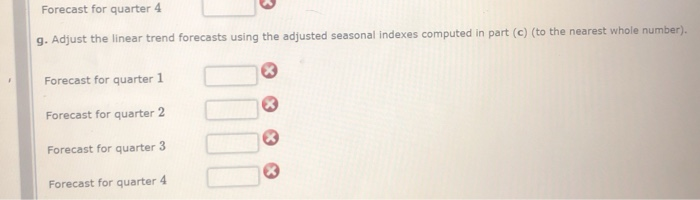
The quarterly sales data (number of copies sold) for a college textbook over the past three years follow. Click on the datafile logo to reference the data. DATA file Quarter Year 1 Year 2 Year 3 1690 1800 1850 1100 2930 940 2625 2500 900 3. 2900 2360 2615 a. Which of the following time series plots is correct for this data? 1. 3500 3000 2500 2000 1500 1000 500 10 11 12 Period 00 2. 3500 3000 2500 2000 1500 1000 500 9 10 11 12 7. Period 8. 3. 3500 3000 2500 2000 * 1500 1000 500 89 10 11 12 3. Period Time Series Value Select your answer What type of pattern exists in the data? Select your answer b. Show the four-quarter and centered moving average values for this time series (to 3 decimals if necessary). Year Quarter Time Series Four-Quarter Centered Value Moving Moving Average Average 1690 940 1952.5 2625 1952.5 1966.2 2500 1961.2 1956.2 1800 2. 2. 1800 900 3 2900 2360 1850 3 1100 2930 3. 2615 c. Compute the seasonal and adjusted seasonal indexes for the four quarters (to 3 decimals). Quarter Seasonal Adjusted Index Seasonal Index 1. 3 4. Total d. When does the publisher have the largest seasonal index? Select your answer - Does this result appear reasonable? Select your answer e. Deseasonalize the time series (to 3 decimals). Deseasonalized Value Quarter Year Deseasonalized Value Quarter Year 4. 3. 2. 2. 3 3 f. Compute the linear trend equation for the deseasonalized data (to 1 decimal if necessary). Period Deseasonalized Value = Compute the forecast sales using the linear trend equation (to 1 decimal). Forecast for quarter 1 Forecast for quarter 2 Forecast for quarter 3 Forecast for quarter 4 g. Adjust the linear trend forecasts using the adjusted seasonal indexes computed in part (c) (to the Forecast for quarter 1 Forecast for quarter 2 Forecast for quarter 4 g. Adjust the linear trend forecasts using the adjusted seasonal indexes computed in part (c) (to the nearest whole number). Forecast for quarter 1 Forecast for quarter 2 Forecast for quarter 3 Forecast for quarter 4 The quarterly sales data (number of copies sold) for a college textbook over the past three years follow. Click on the datafile logo to reference the data. DATA file Quarter Year 1 Year 2 Year 3 1690 1800 1850 1100 2930 940 2625 2500 900 3. 2900 2360 2615 a. Which of the following time series plots is correct for this data? 1. 3500 3000 2500 2000 1500 1000 500 10 11 12 Period 00 2. 3500 3000 2500 2000 1500 1000 500 9 10 11 12 7. Period 8. 3. 3500 3000 2500 2000 * 1500 1000 500 89 10 11 12 3. Period Time Series Value Select your answer What type of pattern exists in the data? Select your answer b. Show the four-quarter and centered moving average values for this time series (to 3 decimals if necessary). Year Quarter Time Series Four-Quarter Centered Value Moving Moving Average Average 1690 940 1952.5 2625 1952.5 1966.2 2500 1961.2 1956.2 1800 2. 2. 1800 900 3 2900 2360 1850 3 1100 2930 3. 2615 c. Compute the seasonal and adjusted seasonal indexes for the four quarters (to 3 decimals). Quarter Seasonal Adjusted Index Seasonal Index 1. 3 4. Total d. When does the publisher have the largest seasonal index? Select your answer - Does this result appear reasonable? Select your answer e. Deseasonalize the time series (to 3 decimals). Deseasonalized Value Quarter Year Deseasonalized Value Quarter Year 4. 3. 2. 2. 3 3 f. Compute the linear trend equation for the deseasonalized data (to 1 decimal if necessary). Period Deseasonalized Value = Compute the forecast sales using the linear trend equation (to 1 decimal). Forecast for quarter 1 Forecast for quarter 2 Forecast for quarter 3 Forecast for quarter 4 g. Adjust the linear trend forecasts using the adjusted seasonal indexes computed in part (c) (to the Forecast for quarter 1 Forecast for quarter 2 Forecast for quarter 4 g. Adjust the linear trend forecasts using the adjusted seasonal indexes computed in part (c) (to the nearest whole number). Forecast for quarter 1 Forecast for quarter 2 Forecast for quarter 3 Forecast for quarter 4
Step by Step Solution
There are 3 Steps involved in it

Get step-by-step solutions from verified subject matter experts