

Question: The question asks to draw on the second graph the stock curve stock = Integral of (outflow- inflow) by time Checking the units, it goes
The question asks to draw on the second graph the stock curve stock = Integral of (outflow- inflow) by time
Checking the units, it goes from unit/time to unit so it's the area under the curve of (outflow-inflow). I am having trouble finding the resultant curve of (outflow-inflow). Once that is found, the stock values will be the area under that resultant curve.
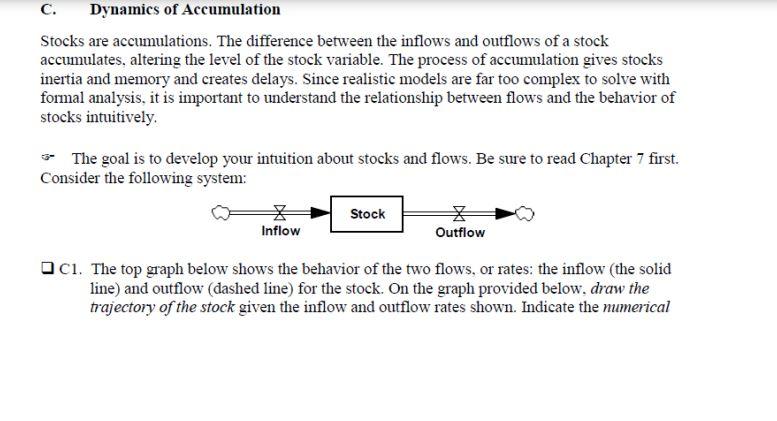
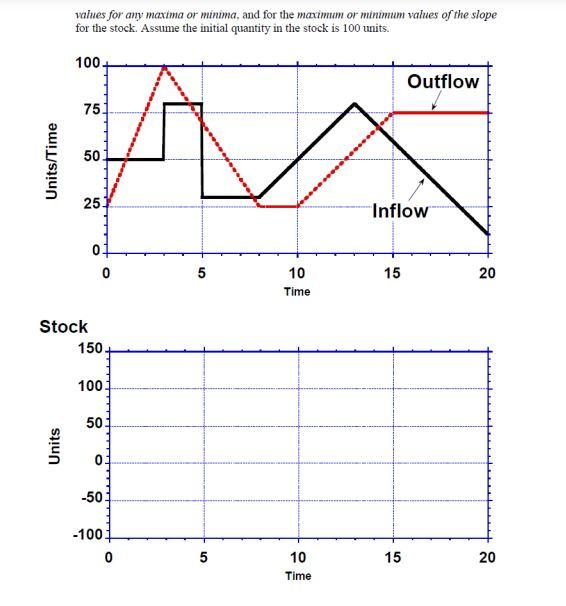
c. Dynamics of Accumulation Stocks are accumulations. The difference between the inflows and outflows of a stock accumulates, altering the level of the stock variable. The process of accumulation gives stocks inertia and memory and creates delays. Since realistic models are far too complex to solve with formal analysis, it is important to understand the relationship between flows and the behavior of stocks intuitively. * The goal is to develop your intuition about stocks and flows. Be sure to read Chapter 7 first. Consider the following system: Stock X Inflow Outflow aci. The top graph below shows the behavior of the two flows, or rates: the inflow (the solid line) and outflow (dashed line) for the stock. On the graph provided below, draw the trajectory of the stock given the inflow and outflow rates shown. Indicate the numerical values for any maxima or minima, and for the maximum or minimum values of the slope for the stock. Assume the initial quantity in the stock is 100 units. 100 Outflow 75 Units/Time 50 25 "Inflow 02 0 5 15 10 Time 20 Stock 150. 100 50. Units 0 -50 -1001 0 5 5 15 20 10 Time c. Dynamics of Accumulation Stocks are accumulations. The difference between the inflows and outflows of a stock accumulates, altering the level of the stock variable. The process of accumulation gives stocks inertia and memory and creates delays. Since realistic models are far too complex to solve with formal analysis, it is important to understand the relationship between flows and the behavior of stocks intuitively. * The goal is to develop your intuition about stocks and flows. Be sure to read Chapter 7 first. Consider the following system: Stock X Inflow Outflow aci. The top graph below shows the behavior of the two flows, or rates: the inflow (the solid line) and outflow (dashed line) for the stock. On the graph provided below, draw the trajectory of the stock given the inflow and outflow rates shown. Indicate the numerical values for any maxima or minima, and for the maximum or minimum values of the slope for the stock. Assume the initial quantity in the stock is 100 units. 100 Outflow 75 Units/Time 50 25 "Inflow 02 0 5 15 10 Time 20 Stock 150. 100 50. Units 0 -50 -1001 0 5 5 15 20 10 Time
Step by Step Solution
There are 3 Steps involved in it

Get step-by-step solutions from verified subject matter experts