

Question: The Question: e. What are the monthly indexes? (Round your answers to 3 decimal places.) Month Index 1 A 10 11 12 f. Forecast sales
The Question:
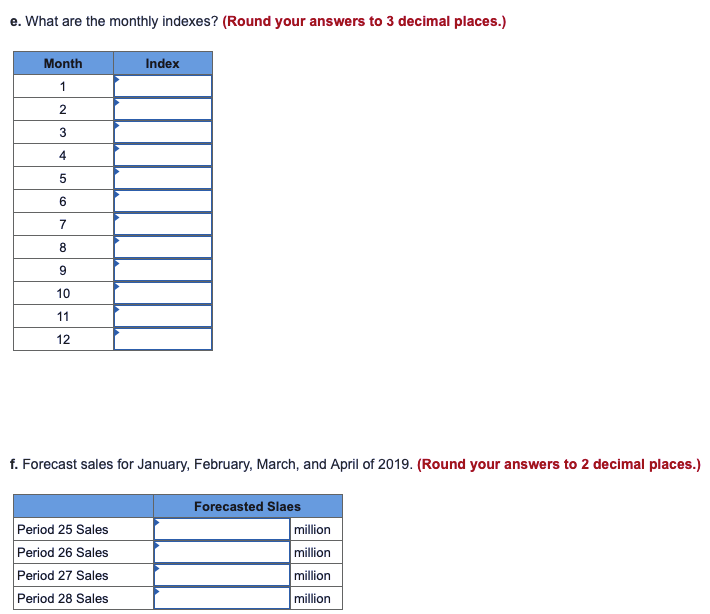
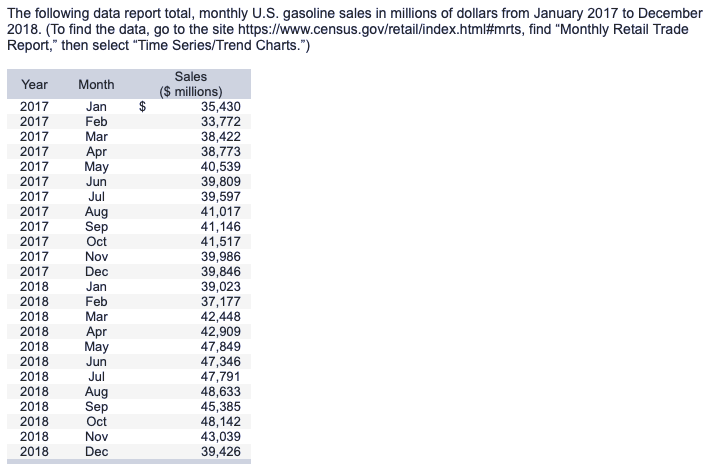

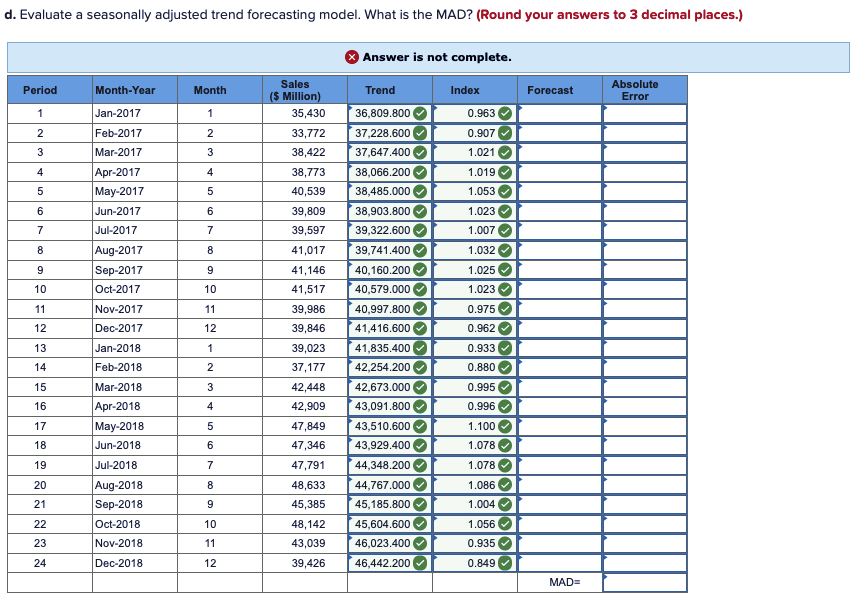
e. What are the monthly indexes? (Round your answers to 3 decimal places.) Month Index 1 A 10 11 12 f. Forecast sales for January, February, March, and April of 2019. (Round your answers to 2 decimal places.) Forecasted Slaes Period 25 Sales million Period 26 Sales million Period 27 Sales million Period 28 Sales millionThe following data report total, monthly U.S. gasoline sales in millions of dollars from January 2017 to December 2018. (To find the data, go to the site https://www.census.gov/retail/index.html#mrts, find "Monthly Retail Trade Report," then select "Time Series/Trend Charts.") Year Month Sales ($ millions) 2017 Jan 35,430 2017 Feb 33,772 2017 Mar 38,422 2017 Apr 38,773 2017 May 40,539 2017 Jun 39,809 2017 Jul 39,597 2017 Aug 41,017 2017 Sep 41,146 2017 Oct 41,517 2017 Nov 39,986 2017 Dec 39,846 2018 Jan 39,023 2018 Feb 37,177 2018 Mar 42,448 2018 Apr 42,909 2018 May 47,849 2018 Jun 47,346 2018 Jul 47,791 2018 Aug 48,633 2018 Sep 45,385 2018 Oct 48,142 2018 Nov 43,039 2018 Dec 39,426d. Evaluate a seasonally adjusted trend forecasting model. What is the MAD? (Round your answers to 3 decimal places.)
Step by Step Solution
There are 3 Steps involved in it

Get step-by-step solutions from verified subject matter experts