

Question: The question is asking for the minimum interest rate to make the IRR 10%. It is asking to explore a different method to determine the
The question is asking for the minimum interest rate to make the IRR 10%. It is asking to explore a different method to determine the best course of action for the company. 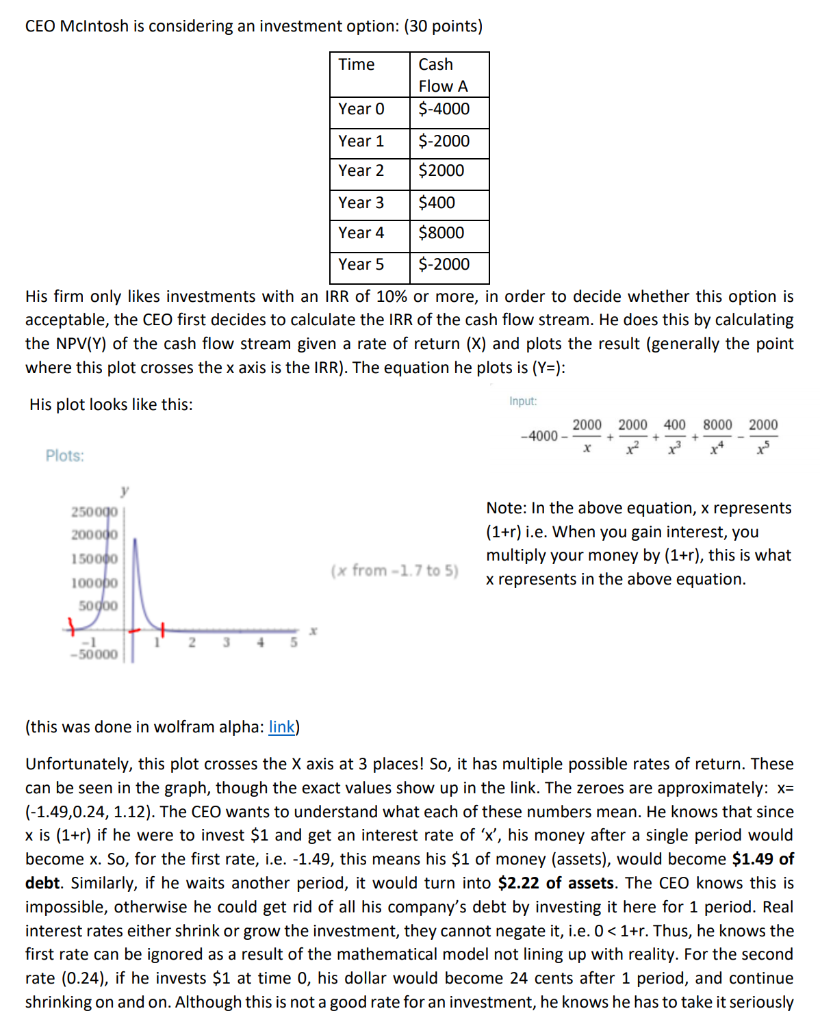
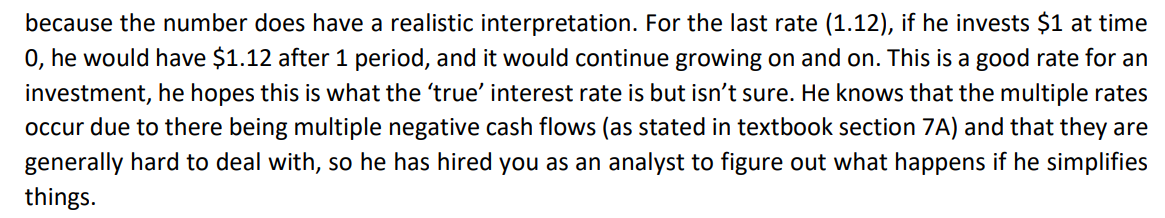
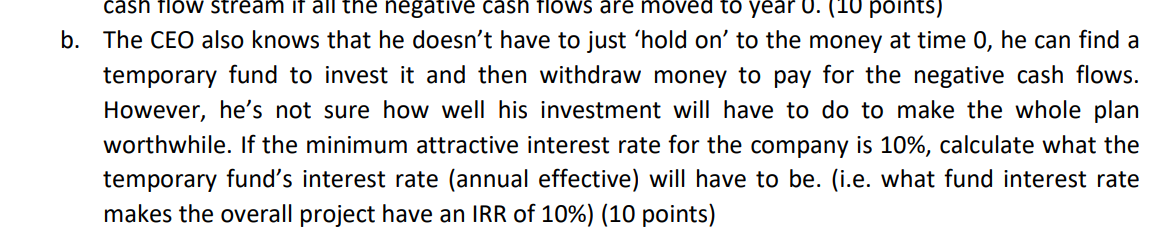
CEO McIntosh is considering an investment option: (30 points) Time Cash Flow A $-4000 Year 0 Year 1 Year 2 $-2000 $2000 $400 Year 3 Year 4 $8000 Year 5 $-2000 acceptable, the CEO first decides to calculate the IRR of the cash flow stream. He does this by calculating the NPV(Y) of the cash flow stream given a rate of return (X) and plots the result (generally the point where this plot crosses the x axis is the IRR). The equation he plots is (Y=): His plot looks like this: Input: 2000 2000 400 8000 2000 -4000 - xxx* ** Plots: 250 000 200000 150000 100 000 50000 Note: In the above equation, x represents (1+r) i.e. When you gain interest, you multiply your money by (1+r), this is what (x from -1.7 to 5) 1 2 3 4 5 -50000 (this was done in wolfram alpha: link) Unfortunately, this plot crosses the X axis at 3 places! So, it has multiple possible rates of return. These can be seen in the graph, though the exact values show up in the link. The zeroes are approximately: x= (-1.49,0.24, 1.12). The CEO wants to understand what each of these numbers mean. He knows that since xis (1+r) if he were to invest $1 and get an interest rate of 'X', his money after a single period would become x. So, for the first rate, i.e. -1.49, this means his $1 of money (assets), would become $1.49 of debt. Similarly, if he waits another period, it would turn into $2.22 of assets. The CEO knows this is impossible, otherwise he could get rid of all his company's debt by investing it here for 1 period. Real interest rates either shrink or grow the investment, they cannot negate it, i.e. 0
Step by Step Solution
There are 3 Steps involved in it

Get step-by-step solutions from verified subject matter experts