

Question: The question is required to use the data from excel, you may download the file here: https://drive.google.com/file/d/1xNtpohpXJTHZpXgzD279JkSoDOu6afCc/view?usp=sharing You are recommended to use R Studio to
The question is required to use the data from excel, you may download the file here:
https://drive.google.com/file/d/1xNtpohpXJTHZpXgzD279JkSoDOu6afCc/view?usp=sharing
You are recommended to use "R Studio" to finish this question, thank you.
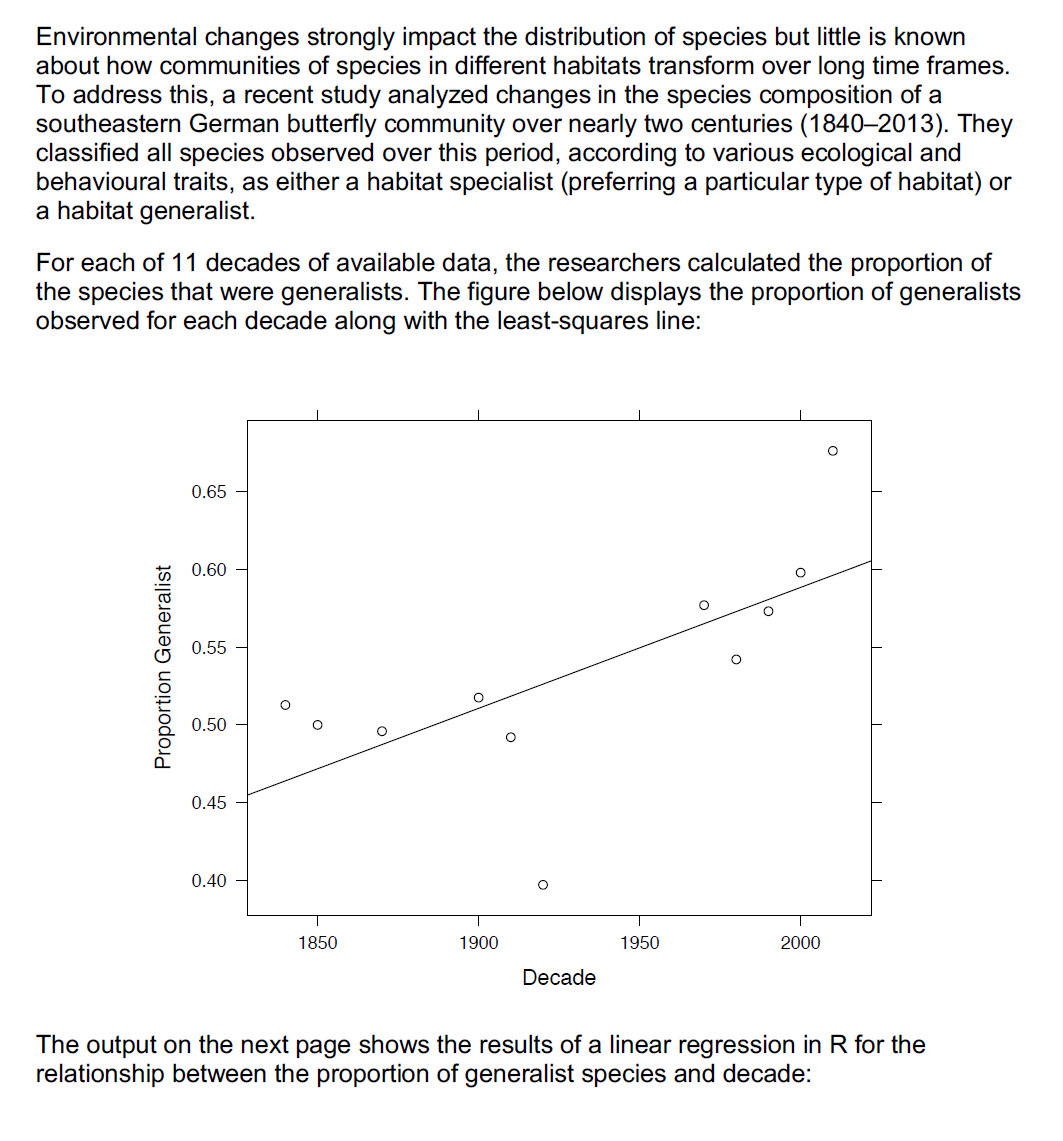
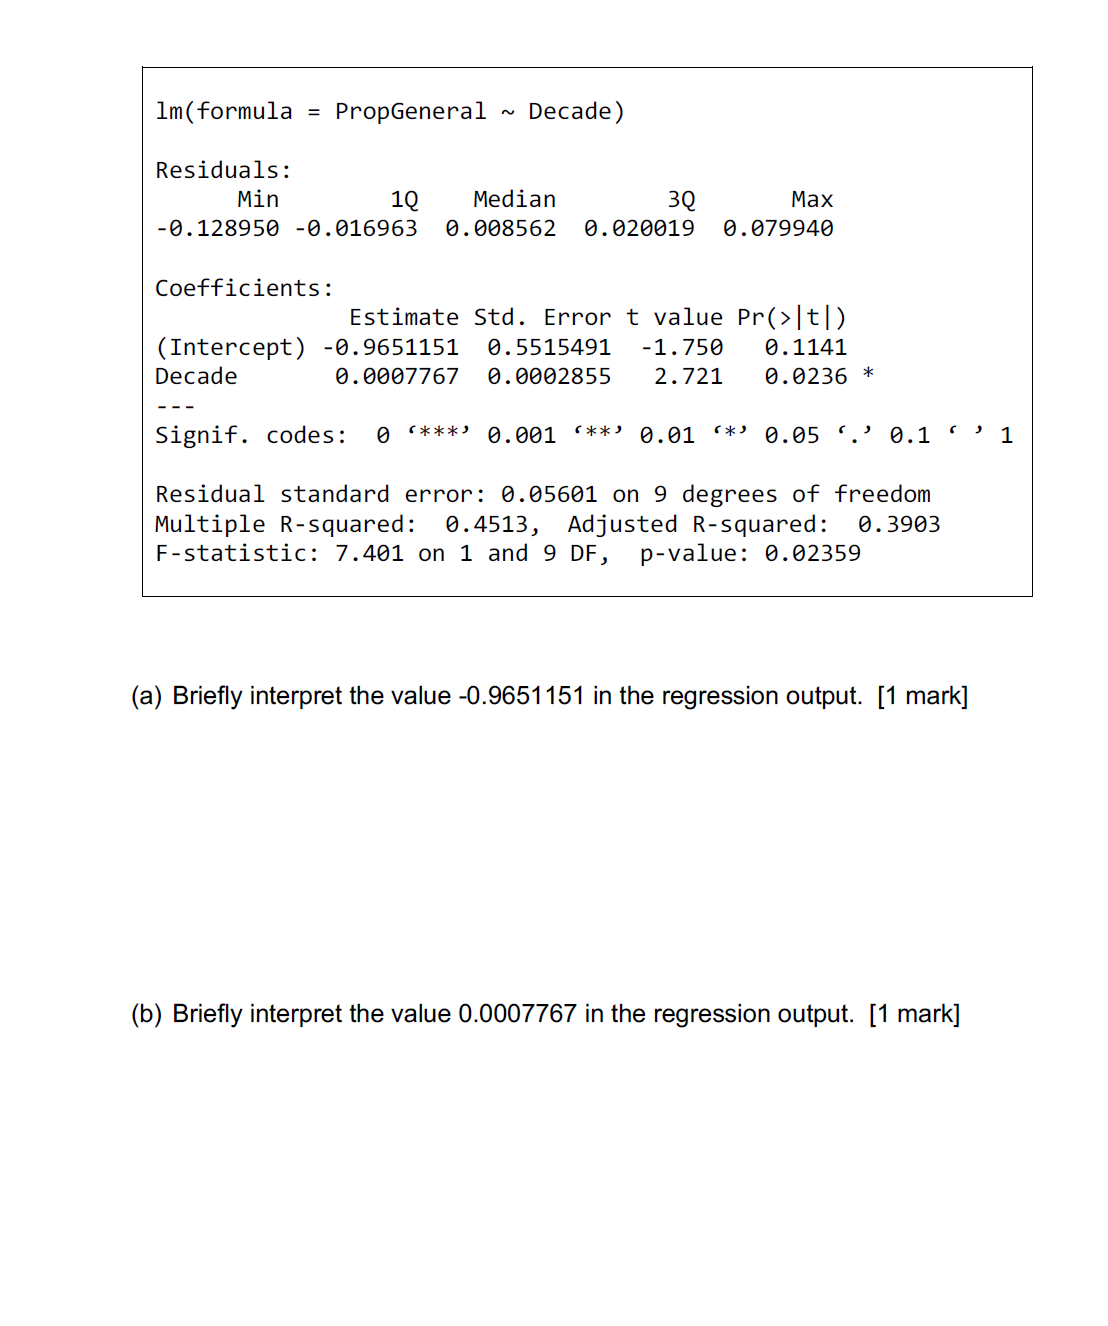
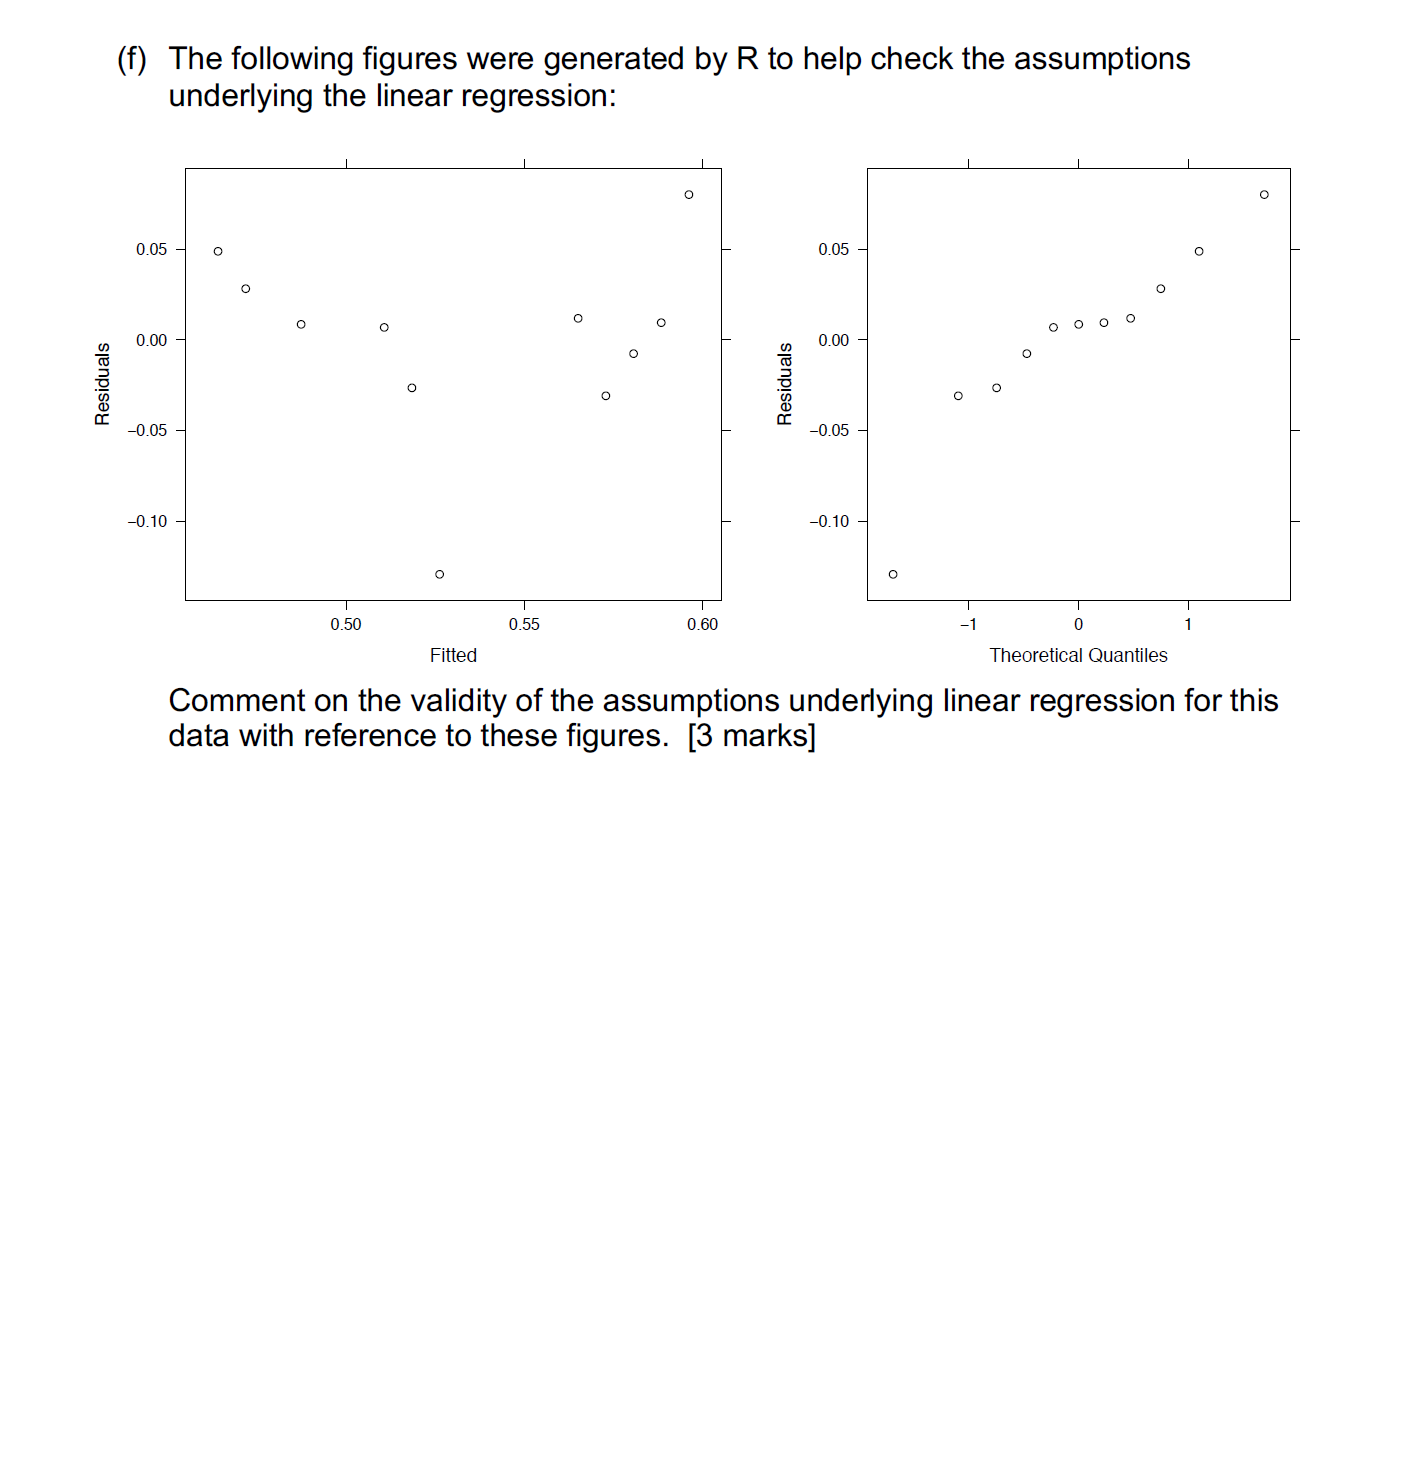
Environmental changes strongly impact the distribution of species but little is known about how communities of species in different habitats transform over long time frames. To address this, a recent study analyzed changes in the species composition of a southeastern German buttery community over nearly two centuries (18402013). They classied all species observed over this period, according to various ecological and behavioural traits, as either a habitat specialist (preferring a particular type of habitat) or a habitat generalist. For each of 11 decades of available data, the researchers calculated the proportion of the species that were generalists. The gure below displays the proportion of generalists observed for each decade along with the least-squares line: 055 ES (160 E {D E (5 055 C .9 t: g; (150 E? D. 0A5 (140 0 _ llll 1850 1900 1950 2000 Decade The output on the next page shows the results of a linear regression in R for the relationship between the proportion of generalist species and decade: lm(formula = PropGeneral ~ Decade) Residuals: Min 10 Median 3Q Max 9.128959 -9.916963 9.998562 9.929919 9.979949 Coefficients: Estimate Std. Error t value Pr(>|t|) (Intercept) -9.9551151 9.5515491 1.759 9.1141 Decade 9.9997767 9.9992855 2.721 9.9236 * Signit. codes: 9 '***' 9.991 '**' 9.91 '*' 9.95 '.' 9.1 ' ' 1 Residual standard error: 9.95691 on 9 degrees of freedom Multiple R-squared: 9.4513, Adjusted Rsquared: 9.3993 Fstatistic: 7.491 on 1 and 9 BF, p-value: 9.92359 (3) Briey interpret the value 09651151 in the regression output. [1 mark] (b) Briey interpret the value 0.000776? in the regression output. [1 mark] (c) Does the regression analysis provide evidence of a change in the proportion of butterfly species that are generalist over time? State the null and alternative hypotheses, and report the appropriate test statistic and P-value from the output. What do you conclude? [3 marks] (d) Give a 95% confidence interval for the underlying slope of the linear relationship between the proportion of generalist species and time. [2 marks] (e) In 1920 the observed proportion of habitat generalists was 0.397. What is the residual associated with 1920 in the regression model? [1 mark] (f) The following figures were generated by R to help check the assumptions underlying the linear regression: O O 0.05 7 o 7 0.05 7 o O O O O O o O O O 0 0.00 0.00 % o T: o g 13 g 0 0 373 o o I 0.05 7 7 a: 0.05 7 0.10 7 7 0.10 7 O O l l l l l l 0.50 0.55 0.60 71 0 1 Fitted Theoretical Quantiles Comment on the validity of the assumptions underlying linear regression for this data with reference to these figures. [3 marks]
Step by Step Solution
There are 3 Steps involved in it

Get step-by-step solutions from verified subject matter experts