

Question: The question is stated below. Suppose Van runs a small business that manufactures shirts. Assume that the market for shirts is a competitive market, and

The question is stated below.

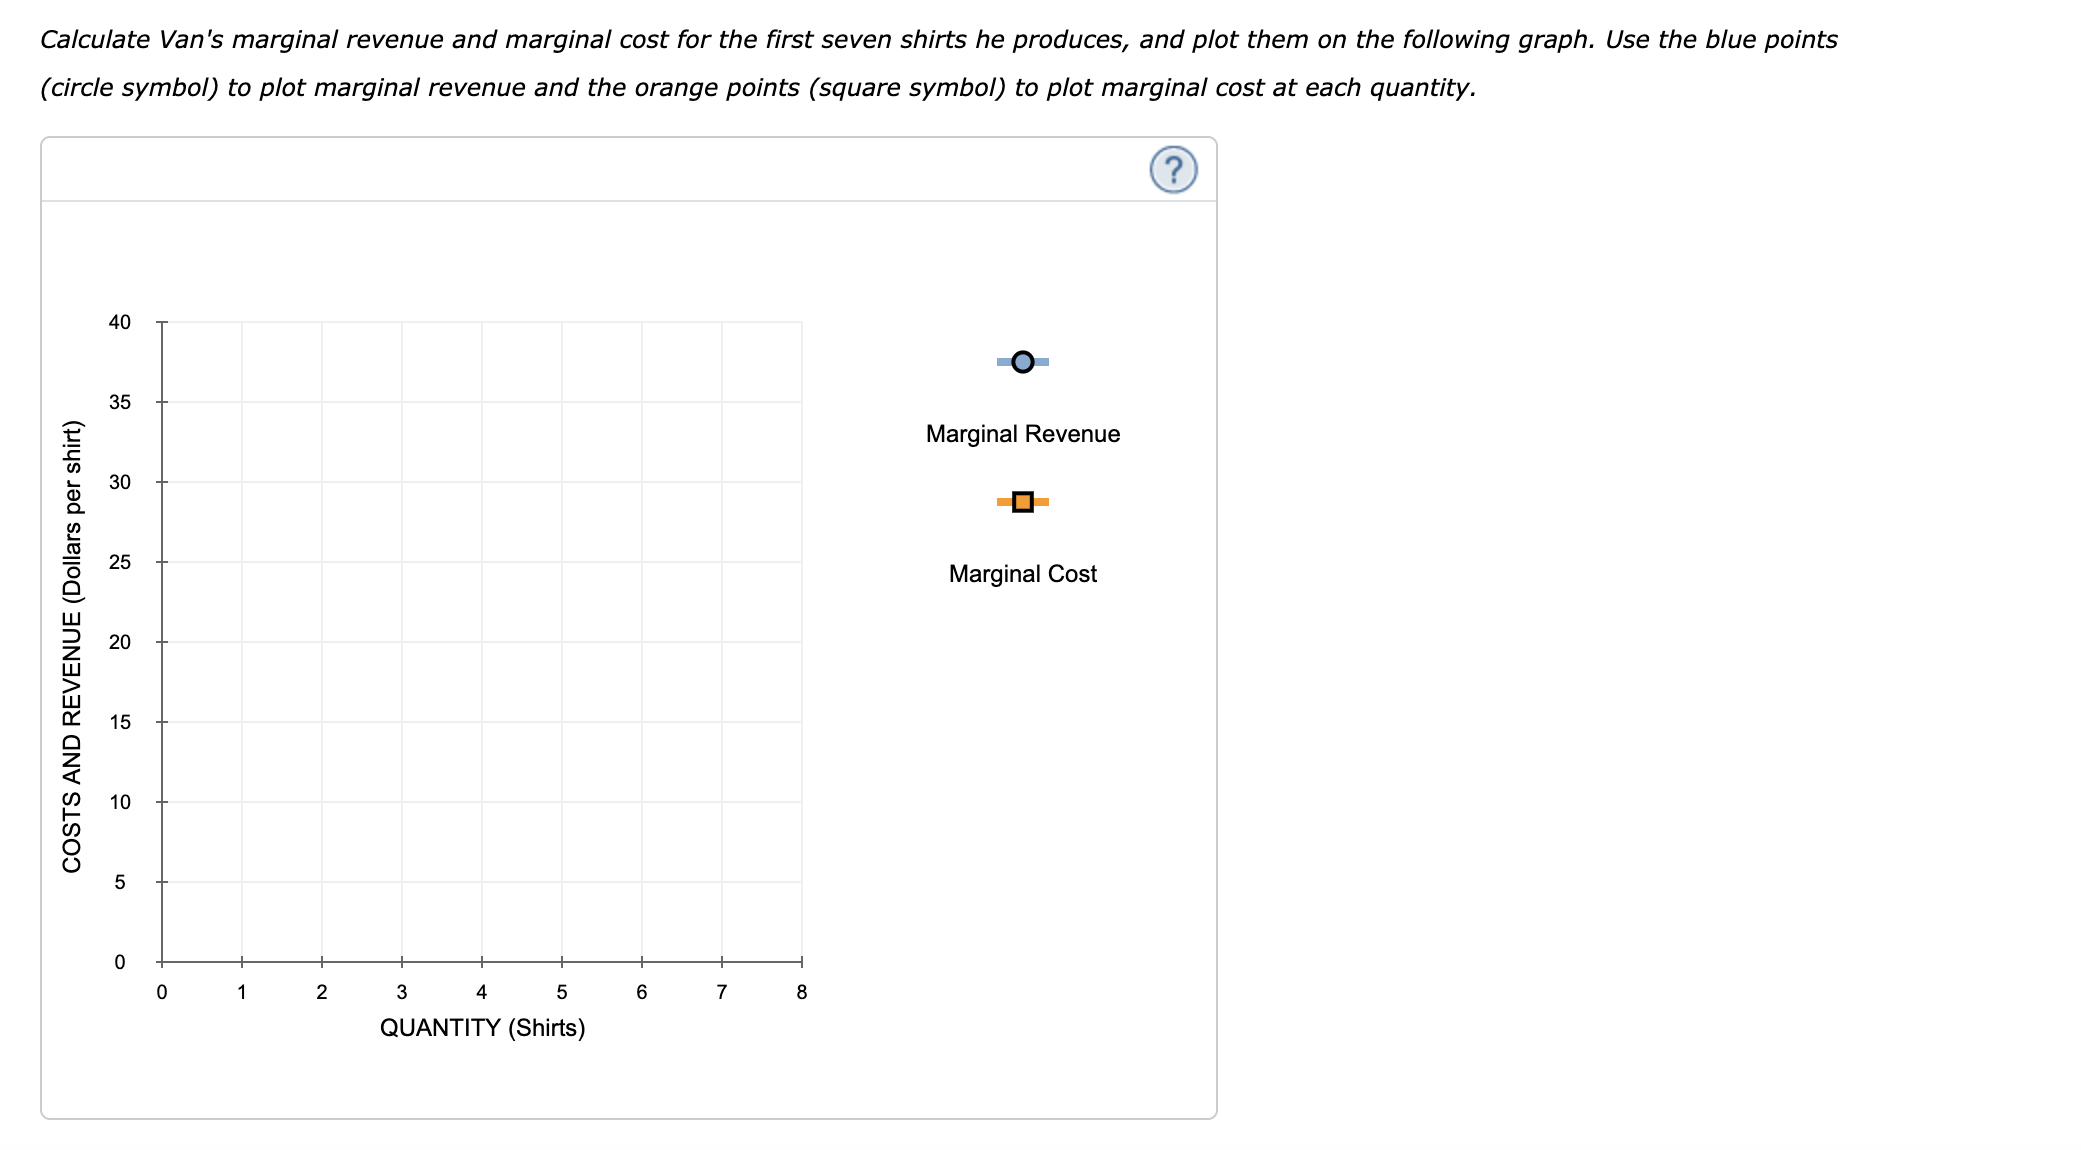

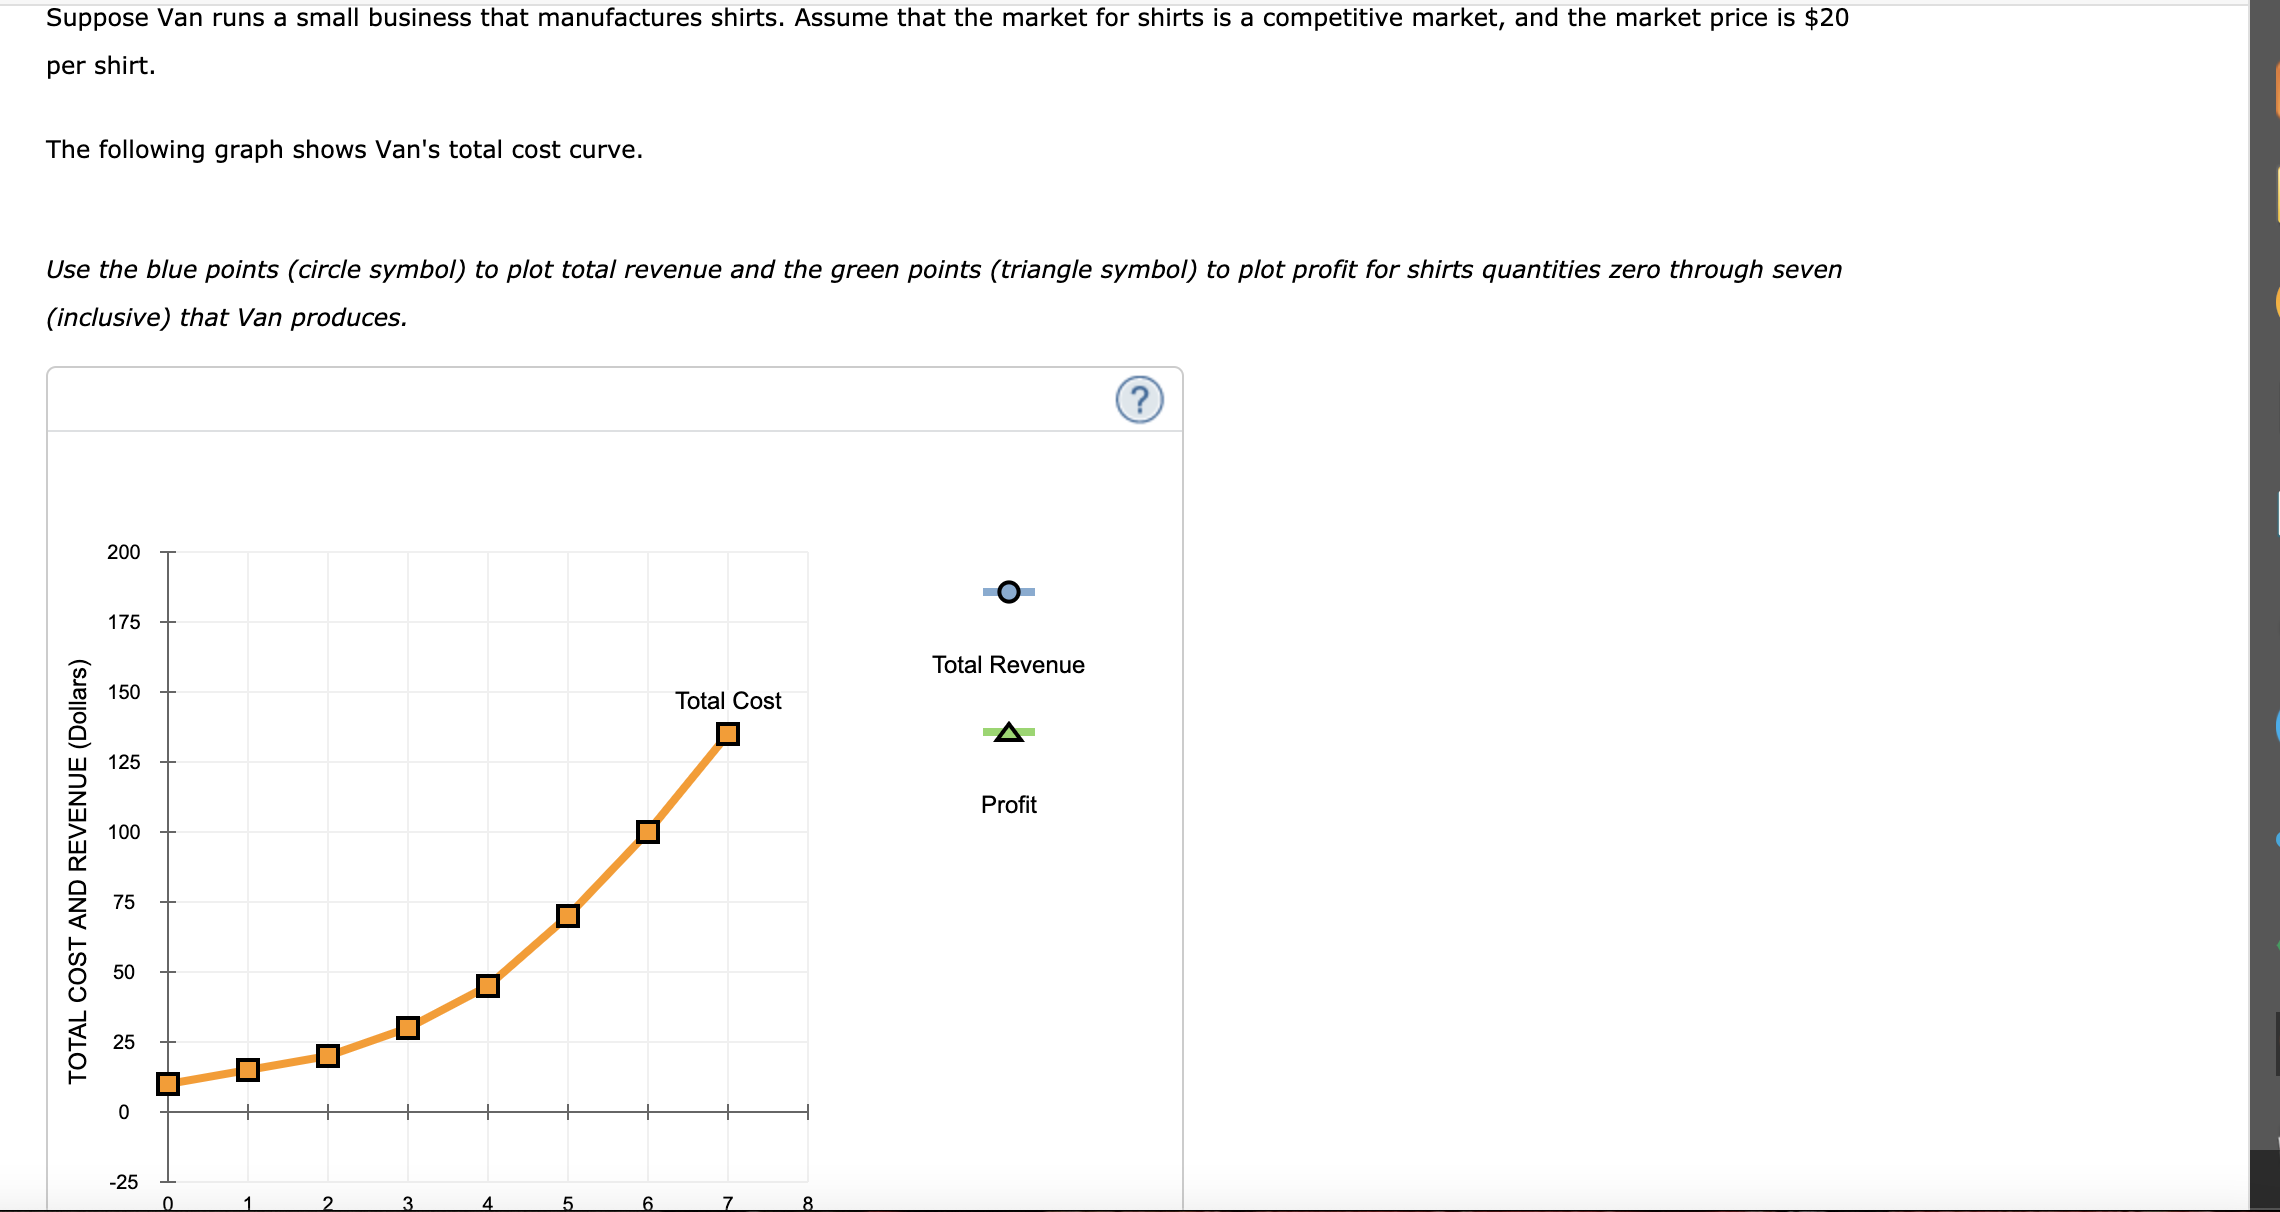
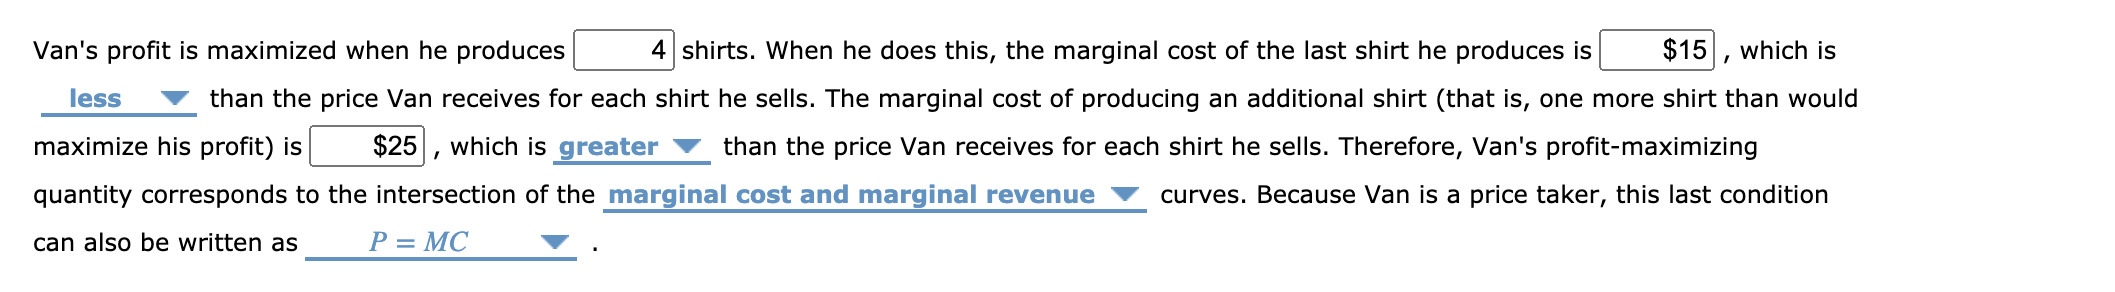
Suppose Van runs a small business that manufactures shirts. Assume that the market for shirts is a competitive market, and the market price is $20 per shirt. The following graph shows Van's total cost curve. Use the blue points (circle symbol) to plot total revenue and the green points (triangle symbol) to plot prot for shirts quantities zero through seven (inclusive) that Van produces. 200 -o- 175 Total Revenue or o l Total Cost $- 125 Prot 1 00 or s: o 0- TOTAL COST AND REVENUE (Dollars) N OI Calculate Van's marginal revenue and marginal cost for the first seven shirts he produces, and plot them on the following graph. Use the blue points (circle symbol) to plot marginal revenue and the orange points (square symbol) to plot marginal cost at each quantity. 40 O 35 Marginal Revenue 30 25 Marginal Cost COSTS AND REVENUE (Dollars per shirt) 20 15 10 5 O 1 2 8 3 4 5 6 7 QUANTITY (Shirts)Van's prot is maximized when he produces 4 shirts. When he does this, the marginal cost of the last shirt he produces is $15 , which is less V than the price Van receives for each shirt he sells. The marginal cost of producing an additional shirt (that is, one more shirt than would maximize his prot) is $25 , which is greater V than the price Van receives for each shirt he sells. Therefore, Van's prot-maximizing quantity corresponds to the intersection of the marginal cost and marginal revenue V curves. Because Van is a price taker, this last condition can also be written as P = MC v
Step by Step Solution
There are 3 Steps involved in it

Get step-by-step solutions from verified subject matter experts