

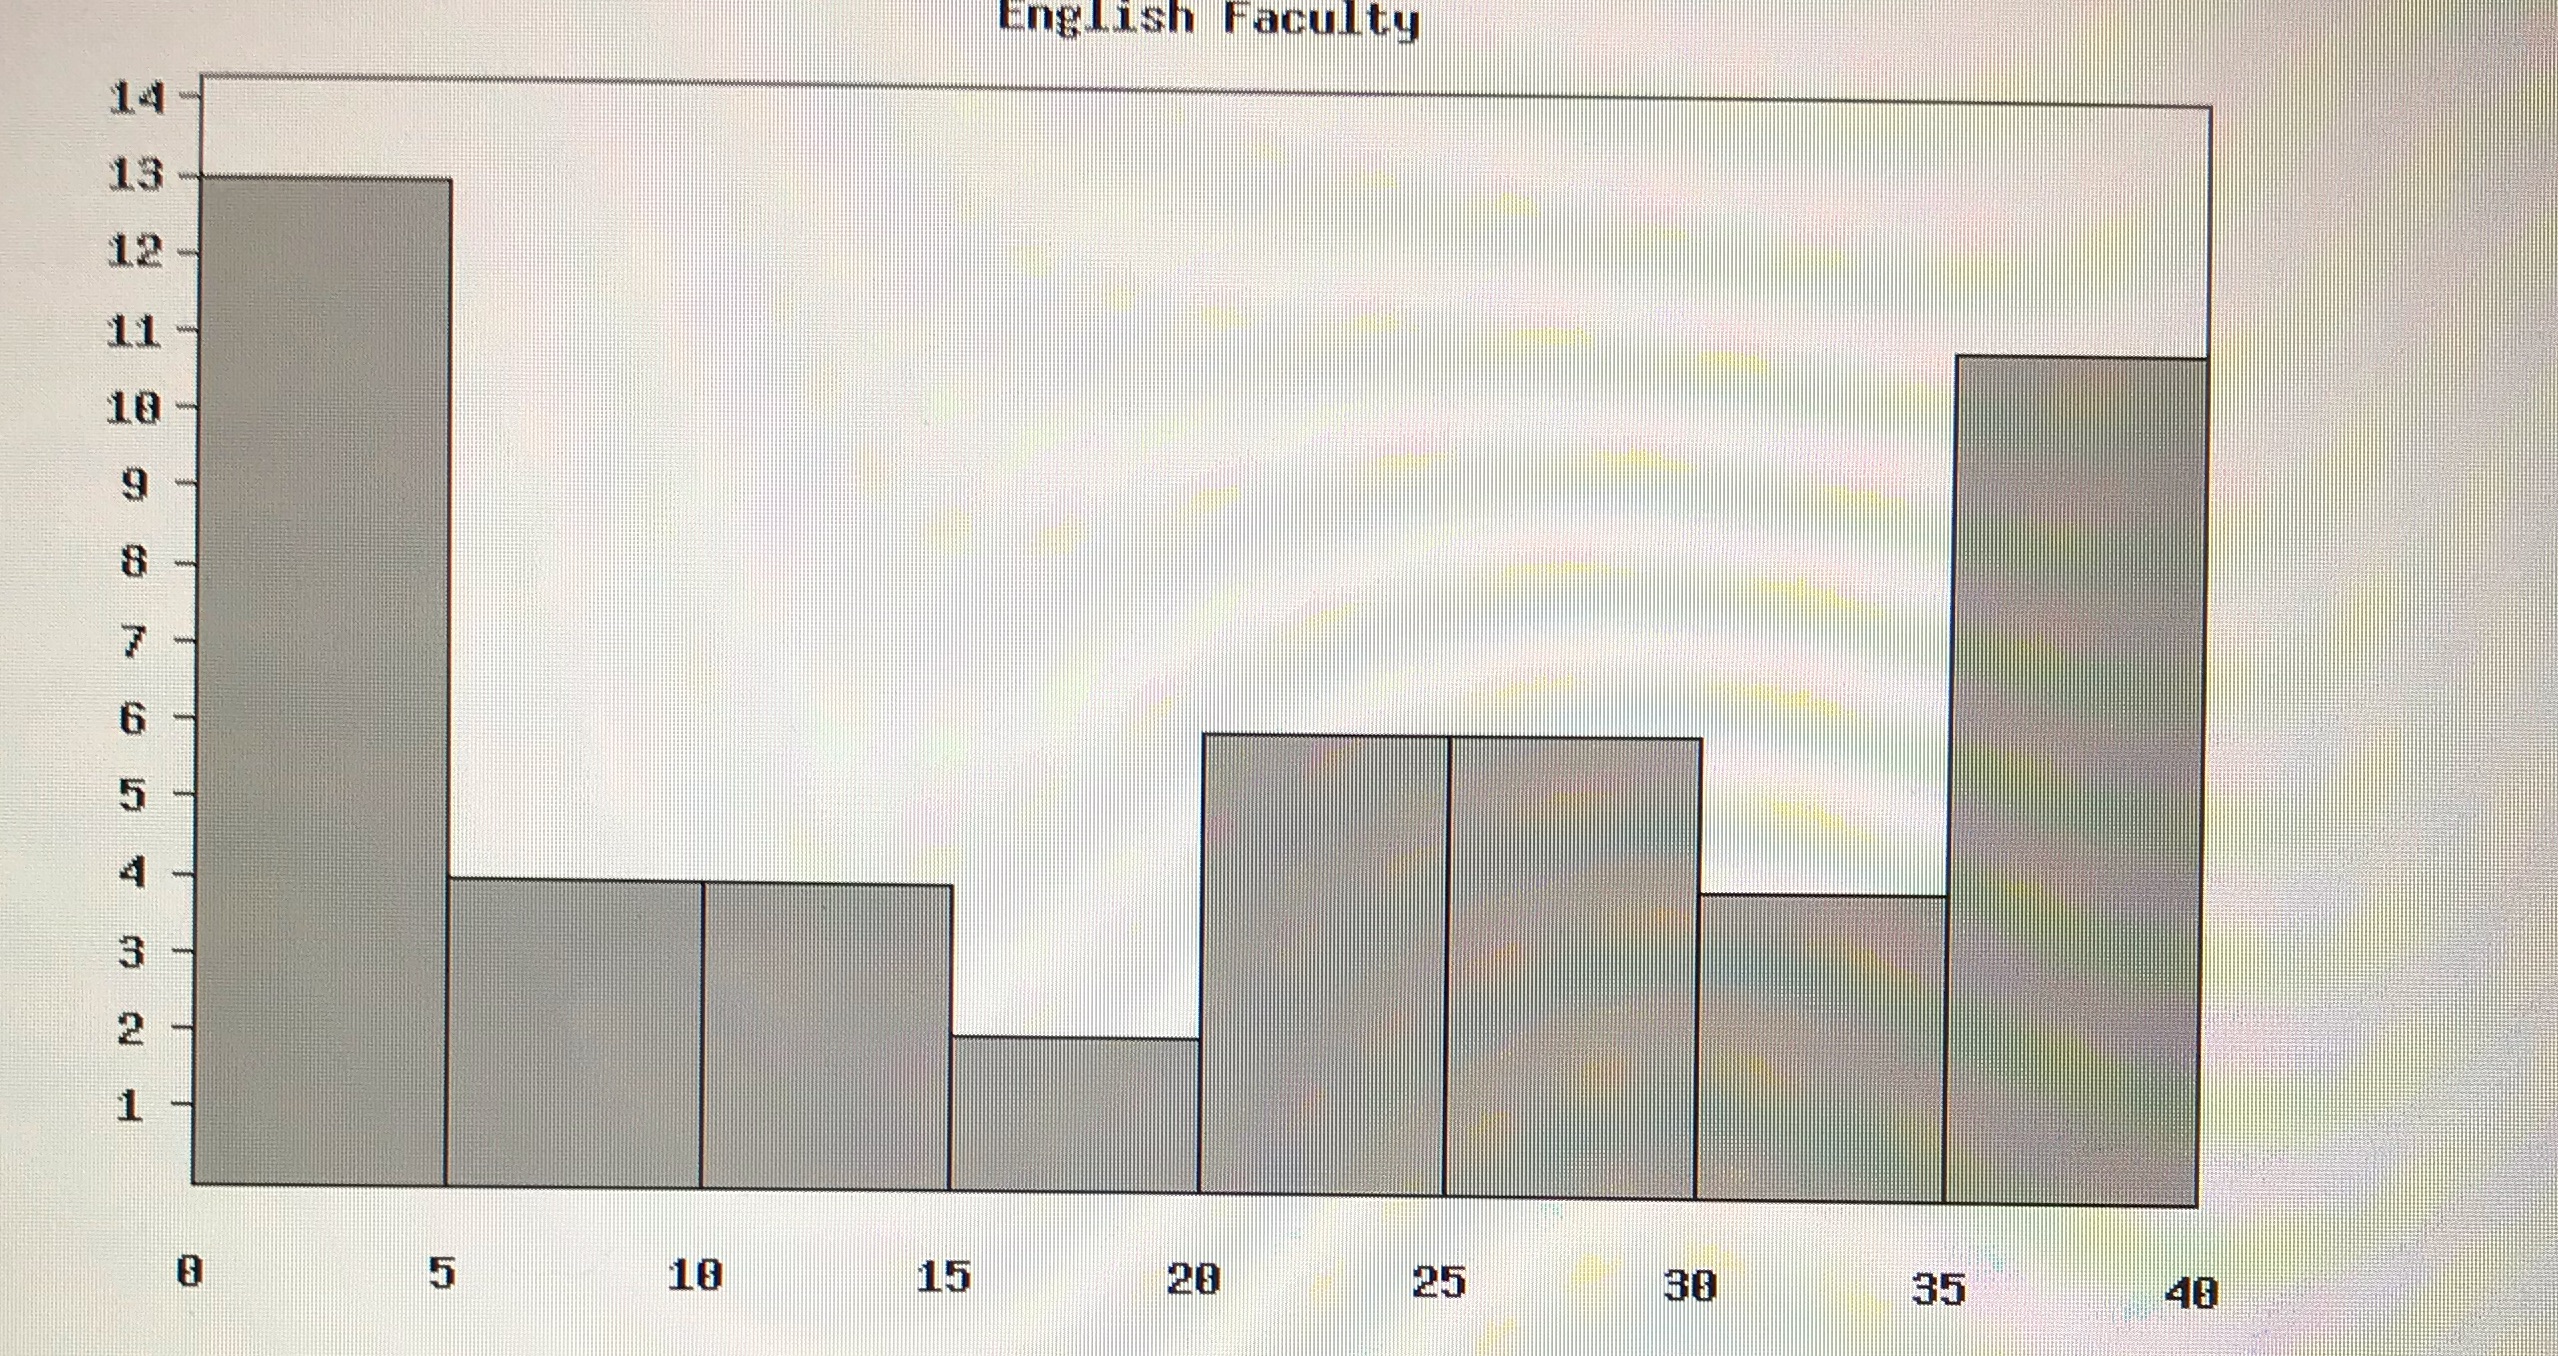
Question: The question is : The histogram below gives the length of service of members of the department of English at a particular university. The classes,
The question is : The histogram below gives the length of service of members of the department of English at a particular university. The classes, in years of service, are 0-4.9, 5-9.9, etc. and the vertical axis represents the number of faculty. A) what percent of the department faculty have less than 15 years of service ? B) If a member of the department is chosen at random to serve on a university committee, what is the probability ( in decimal form ) that the chosen representative have between 15 and 40 years of experience? And C ) what is the probability the representative above will have less than 10 years of service given that the person has less than 20 years of service?
\f
Step by Step Solution
There are 3 Steps involved in it

Get step-by-step solutions from verified subject matter experts