

Question: The question is to graph based on those images SD error bars representing standard deviation should be included in the graph with multiple data points
The question is to graph based on those images
SD error bars representing standard deviation should be included in the graph with multiple data points averaged together
graph a figure legend, and all errors bars and statistical information must be defined in the figure legend
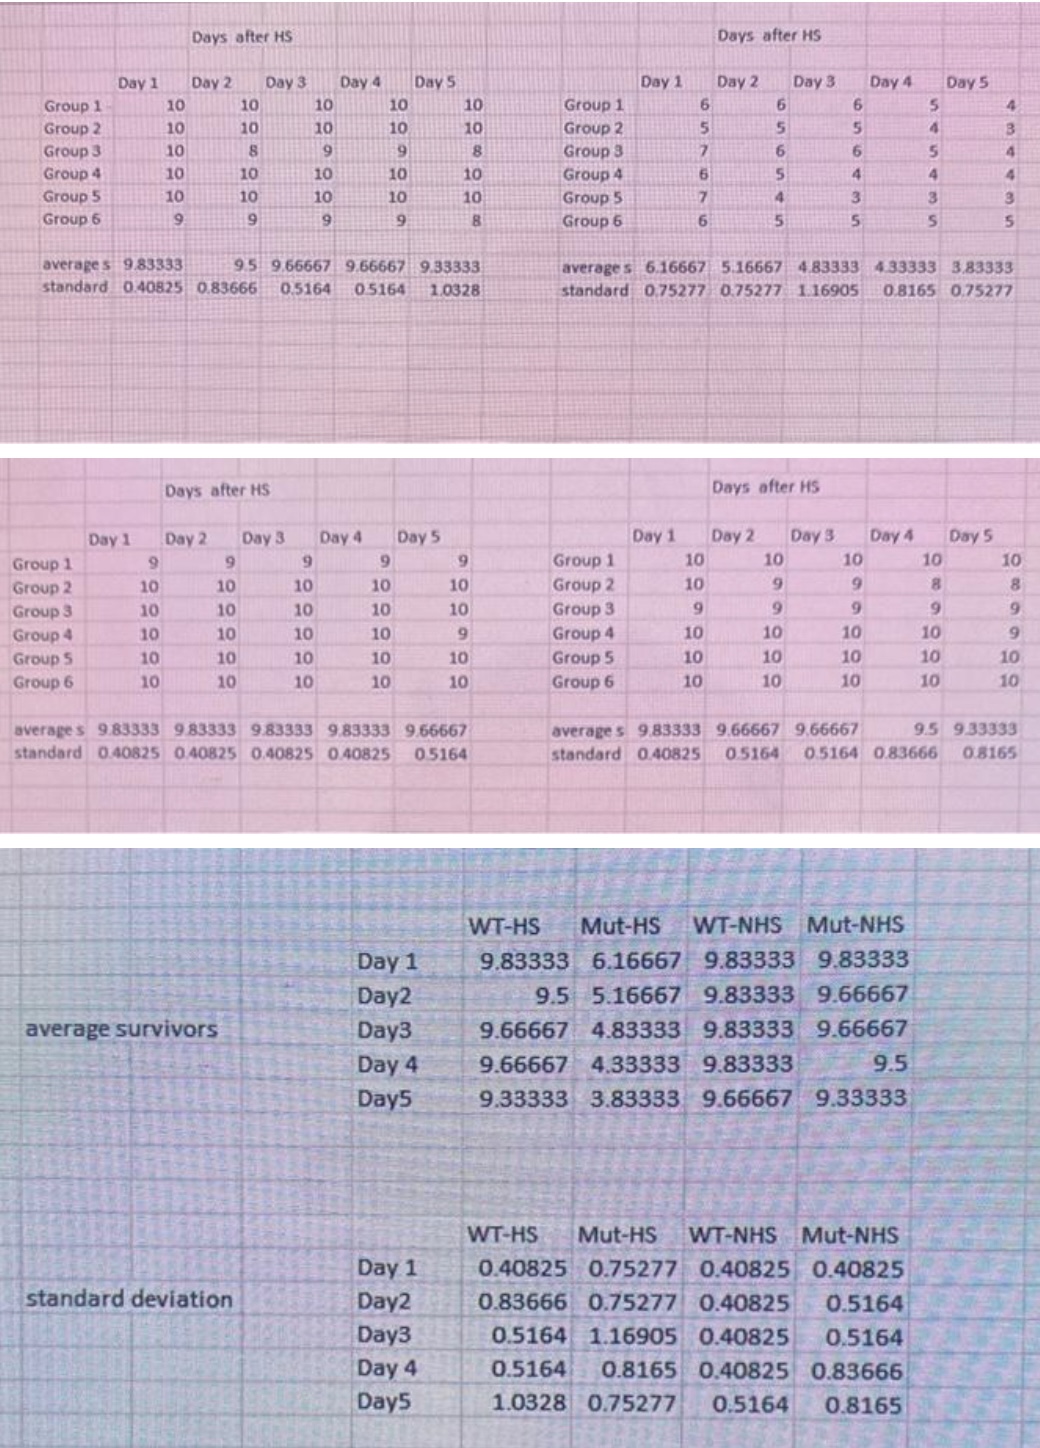
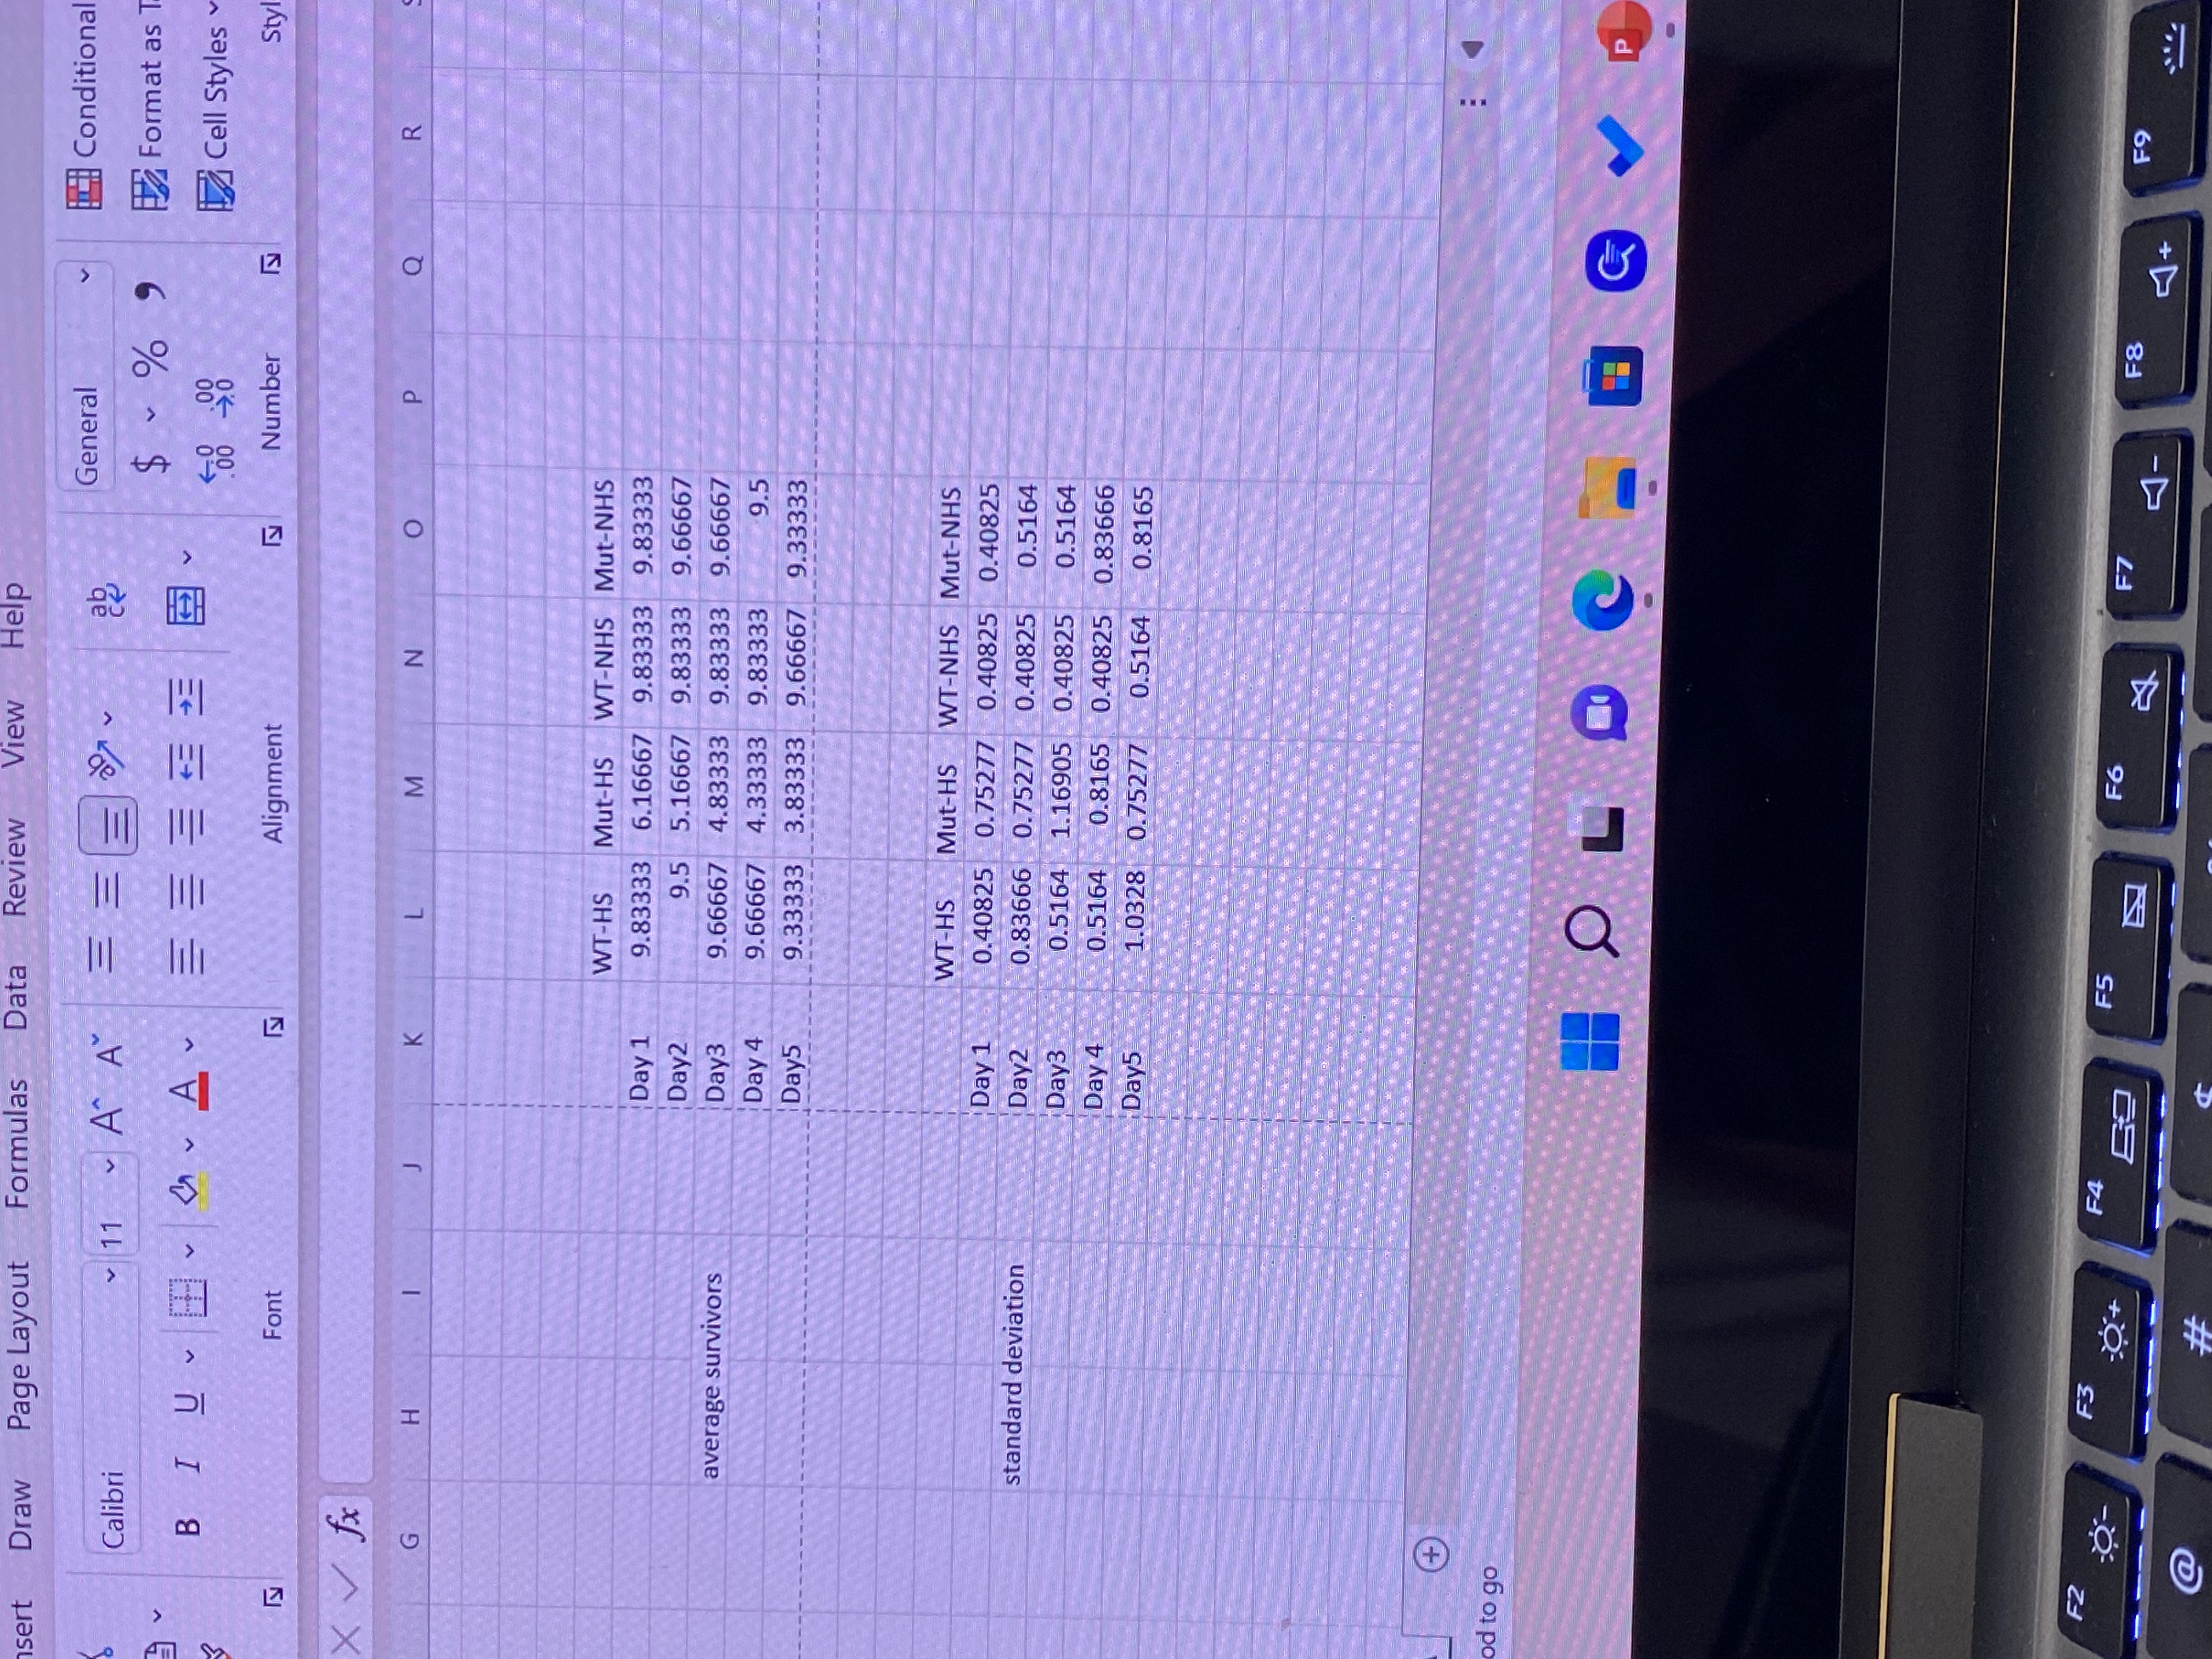
Days after HS Days after HS Day 1 Day 2 Day 3 Day 4 Day 5 Day 1 Day 2 Day 3. Day 4 Day 5 Group 1 10 10 10 10 10 Group 1 Group 2 10 10 10 10 10 Group 2 CO Group 3 10 8 9 Group 3 Group 4 10 10 10 10 10 Group 4 Group 5 10 10 10 10 10 Group 5 3 Group 6 9 9 B Group 6 5 averages 9.83333 9.5 9.65667 9.56667 9.35333 averages 6.16667 5.16567 4.83333 4.33333 3,83333 standard 0.40825 0.83666 0.5164 05164 10328 standard 0.75277 0.75277 1 16905 0.8165 0.75277 Days after HS Days after HS Day 1 Day 2 Day 3 Day 4 Day 5 Day 1 Day 2 Day 3 Day 4 Day 5 Group 1 9 9 9 9 9 Group 1 10 10 10 10 10 Group 2 10 10 10 10 10 Group 2 10 9 8 Group 3 10 10 10 10 10 Group 3 9 Group 4 10 10 10 10 9 Group 4 10 10 10 10 9 Group 5 10 10 10 10 10 Group 5 10 10 10 10 10 Group 6 10 10 10 10 10 Group 6 10 10 10 10 10 averages 983333 9.83333 9:83333 9.89333 9.66567 average's 9.83333 9.66667 9.66667 9.5 9.33333 standard 0.40825 0.40825 0.40825 0.40825 0.5164 standard 0.40825 05164 0.5164 0.83666 0.8165 WT-HS Mut-HS WT-NHS Mut-NHS Day 1 9.83333 6.16667 9.83333 9.83333 Day2 9.5 5.16667 9.83333 9.66667 average survivors Day3 9.66667 4.83333 9.83333 9.66667 Day 4 9.66667 4.33933 9.83333 9.5 Day5 9.33333 3.83353 9.66667 9.33333 WT-HS Mut-HS WT-NHS Mut-NHS Day 1 0.40825 0.75277 0.40825 0.40825 standard deviation Day2 0.83666 0.75277 0.40825 0.5164 Day3 0.5164 1.16905 0.40825 0.5164 Day 4 0.5164 0.8165 0.40825 0.83666 Day5 1.0328 0.75277 0.5164 0.8165sert Draw Page Layout Formulas Data Review View Help General Conditional Calibri 11 A A ~ % Format as T BI UV A 00 .00 1 Cell Styles IN Font Alignment Number Sty X V fx G H K M N O P Q R WT-HS Mut-HS WT-NHS Mut-NHS Day 1 9.83333 6.16667 9.83333 9.83333 Day2 9.5 5.16667 9.83333 9.66667 average survivors Day3 9.66667 4.83333 9.83333 9.66667 Day 4 9.66667 4.33333 9.83333 9.5 Day5 9.33333 3.83333 9.66667 9.33333 WT-HS Mut-HS WT-NHS Mut-NHS Day 1 0.40825 0.75277 0.40825 0.40825 standard deviation Day2 0.83666 0.75277 0.40825 0.5164 Day3 0.5164 1.16905 0.40825 0.5164 Day 4 0.5164 0.8165 0.40825 0.83666 Day5 1.0328 0.75277 0.5164 0.8165 + od to go HOLOC-D V P F2 F3 F4 -O+ F5 F6 F7 F8 F9 @
Step by Step Solution
There are 3 Steps involved in it

Get step-by-step solutions from verified subject matter experts