

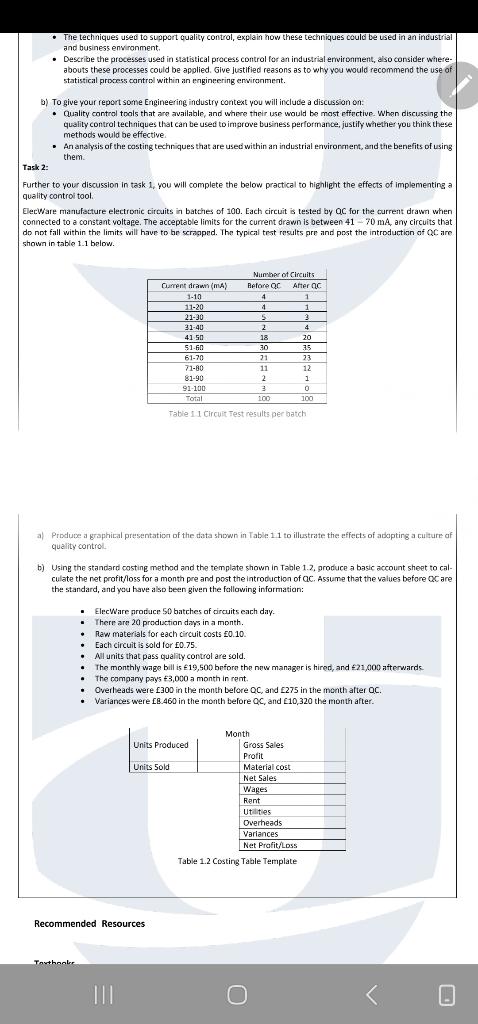
Question: The question Task 2 a ) Said Produce a graphical presentation of the data shown in the table 1 . 1 to illustrate the effects
The question Task a Said Produce a graphical presentation of the data shown in the table to illustrate the effects of adopting a culture of quality control that is the question i paid for.
Step by Step Solution
There are 3 Steps involved in it
1 Expert Approved Answer
Step: 1 Unlock

Question Has Been Solved by an Expert!
Get step-by-step solutions from verified subject matter experts
Step: 2 Unlock
Step: 3 Unlock