

Question: THE QUESTION WILL BE ON FILE PLEASE 9. Elasticity and total revenue The following graph shows the demand curve for kumquats. Points A, B, C,
THE QUESTION WILL BE ON FILE PLEASE
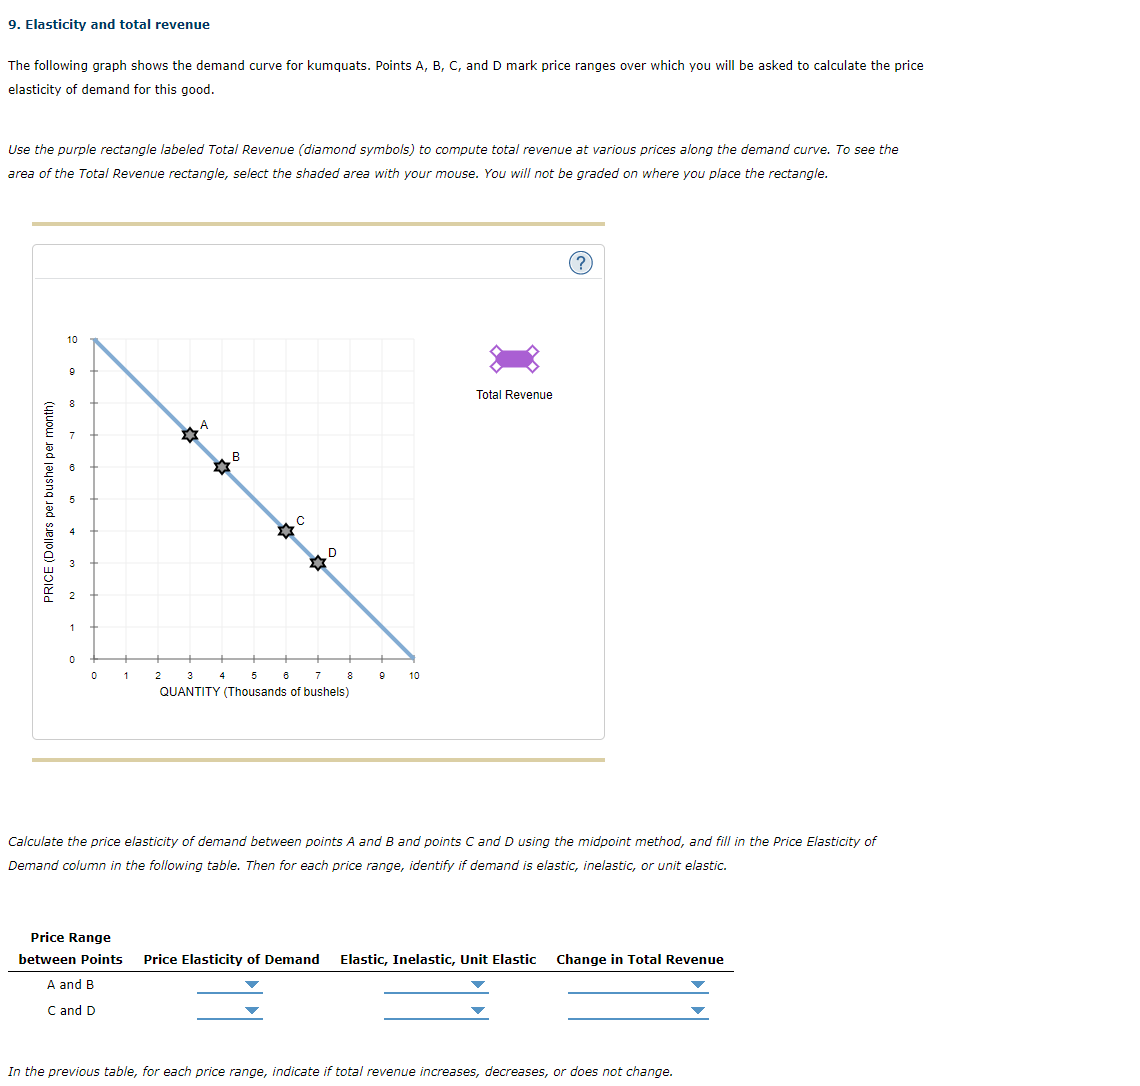
9. Elasticity and total revenue The following graph shows the demand curve for kumquats. Points A, B, C, and D mark price ranges over which you will be asked to calculate the price elasticity of demand for this good. Use the purple rectangle labeled Total Revenue (diamond symbols) to compute total revenue at various prices along the demand curve. To see the area of the Total Revenue rectangle, select the shaded area with your mouse. You will not be graded on where you place the rectangle. 10 PRICE (Dollars per bushel per month) Total Revenue N W 2 3 5 6 7 QUANTITY (Thousands of bushels) Calculate the price elasticity of demand between points A and B and points C and D using the midpoint method, and fill in the Price Elasticity of Demand column in the following table. Then for each price range, identify if demand is elastic, inelastic, or unit elastic. Price Range between Points Price Elasticity of Demand Elastic, Inelastic, Unit Elastic Change in Total Revenue A and B C and D In the previous table, for each price range, indicate if total revenue increases, decreases, or does not change
Step by Step Solution
There are 3 Steps involved in it

Get step-by-step solutions from verified subject matter experts