

Question: the questions will be on file please 8. Long-run cost relationships The following graph shows the short-run average total cost curves and the long-run average
the questions will be on file please
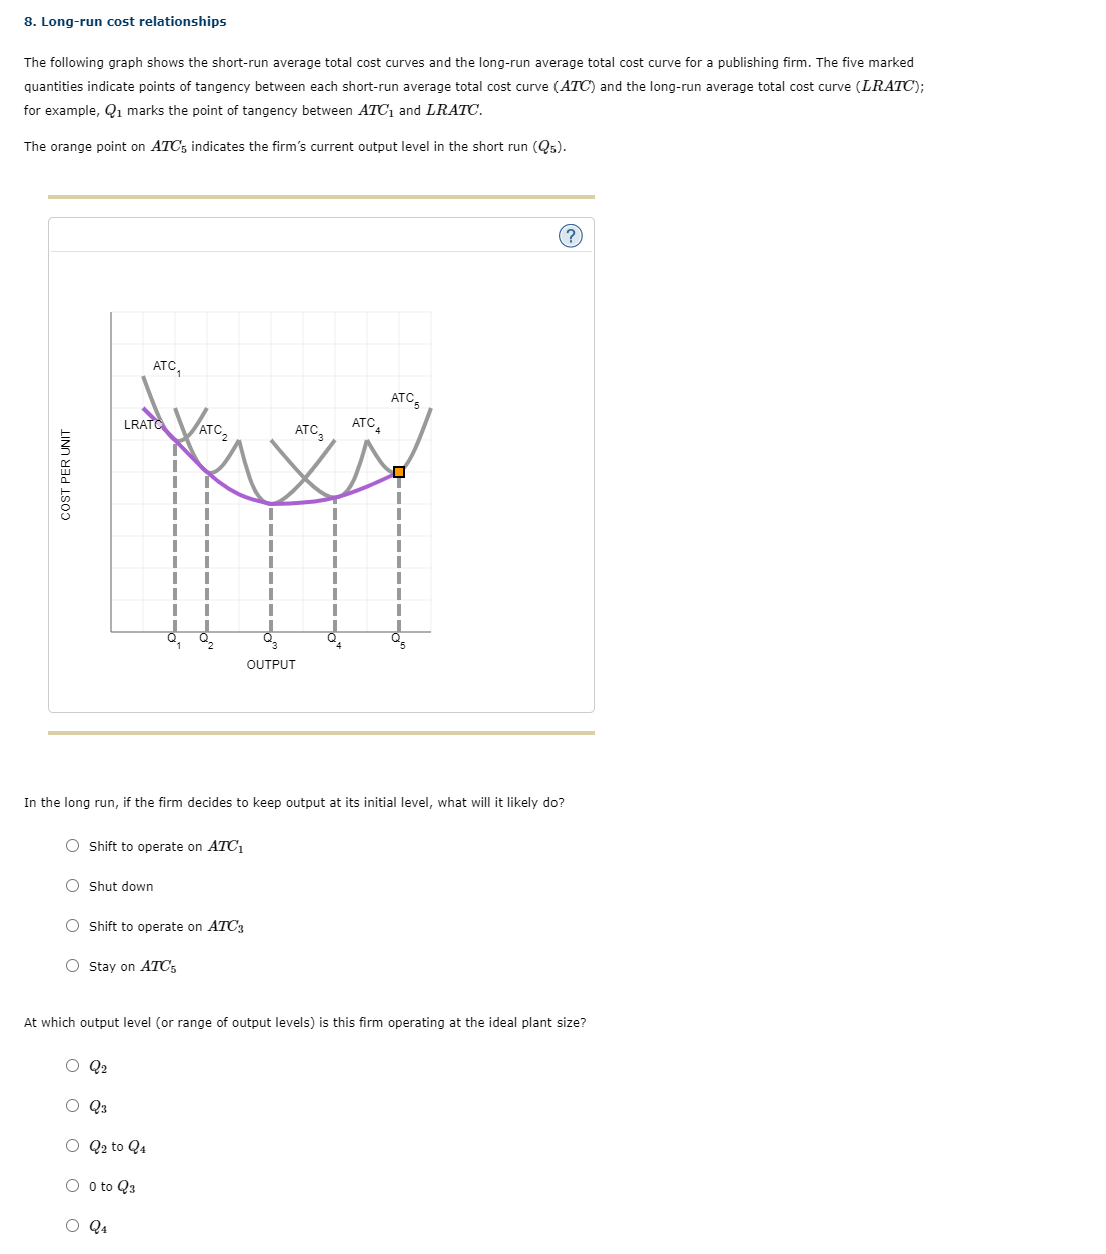
8. Long-run cost relationships The following graph shows the short-run average total cost curves and the long-run average total cost curve for a publishing firm. The five marked quantities indicate points of tangency between each short-run average total cost curve (ATC) and the long-run average total cost curve (LRATC); for example, Q1 marks the point of tangency between ATC, and LRATC. The orange point on ATCs indicates the firm's current output level in the short run (Qs). ? ATC ATC COST PER UNIT LRAT ATC 2 ATC3 ATCA Q, OUTPUT In the long run, if the firm decides to keep output at its initial level, what will it likely do? Shift to operate on ATC, O Shut down O Shift to operate on ATC's O Stay on ATC's At which output level (or range of output levels) is this firm operating at the ideal plant size? O Q2 O Q3 O Q2 to Q4 O 0 to Q3 O Q4
Step by Step Solution
There are 3 Steps involved in it

Get step-by-step solutions from verified subject matter experts