

Question: The questions will refer to the image Consider the schematic diagram below (Figure 1). This figure represents the joint angles produced by the lower limb
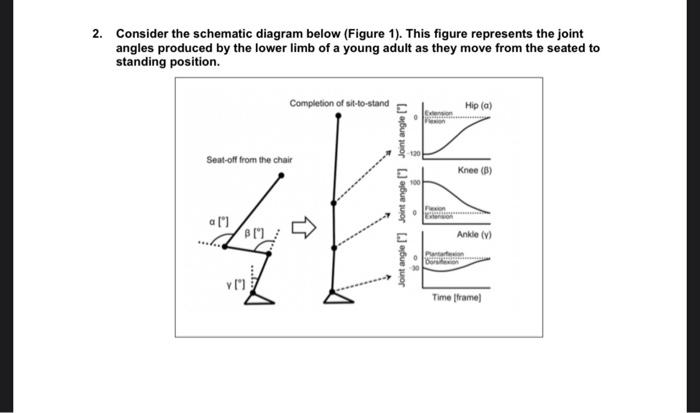
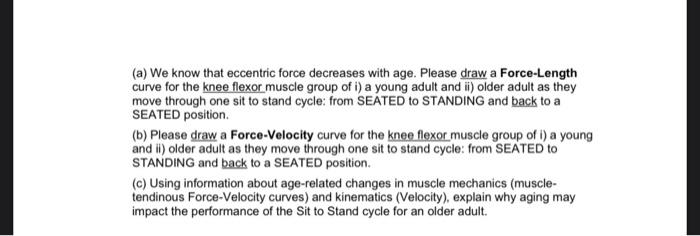
Consider the schematic diagram below (Figure 1). This figure represents the joint angles produced by the lower limb of a young adult as they move from the seated to standing position. (a) We know that eccentric force decreases with age. Please draw a Force-Length curve for the knee flexor muscle group of i) a young adult and ii) older adult as they move through one sit to stand cycle: from SEATED to STANDING and back to a SEATED position. (b) Please draw a Force-Velocity curve for the knee flexor muscle group of i) a young and ii) older adult as they move through one sit to stand cycle: from SEATED to STANDING and back to a SEATED position. (c) Using information about age-related changes in muscle mechanics (muscletendinous Force-Velocity curves) and kinematics (Velocity), explain why aging may impact the performance of the Sit to Stand cycle for an older adult. Consider the schematic diagram below (Figure 1). This figure represents the joint angles produced by the lower limb of a young adult as they move from the seated to standing position. (a) We know that eccentric force decreases with age. Please draw a Force-Length curve for the knee flexor muscle group of i) a young adult and ii) older adult as they move through one sit to stand cycle: from SEATED to STANDING and back to a SEATED position. (b) Please draw a Force-Velocity curve for the knee flexor muscle group of i) a young and ii) older adult as they move through one sit to stand cycle: from SEATED to STANDING and back to a SEATED position. (c) Using information about age-related changes in muscle mechanics (muscletendinous Force-Velocity curves) and kinematics (Velocity), explain why aging may impact the performance of the Sit to Stand cycle for an older adult
Step by Step Solution
There are 3 Steps involved in it

Get step-by-step solutions from verified subject matter experts