

Question: The Queueing Simulator returned the results shown below for a system with 2 servers. Which of the following is most likely to occur? Results Point
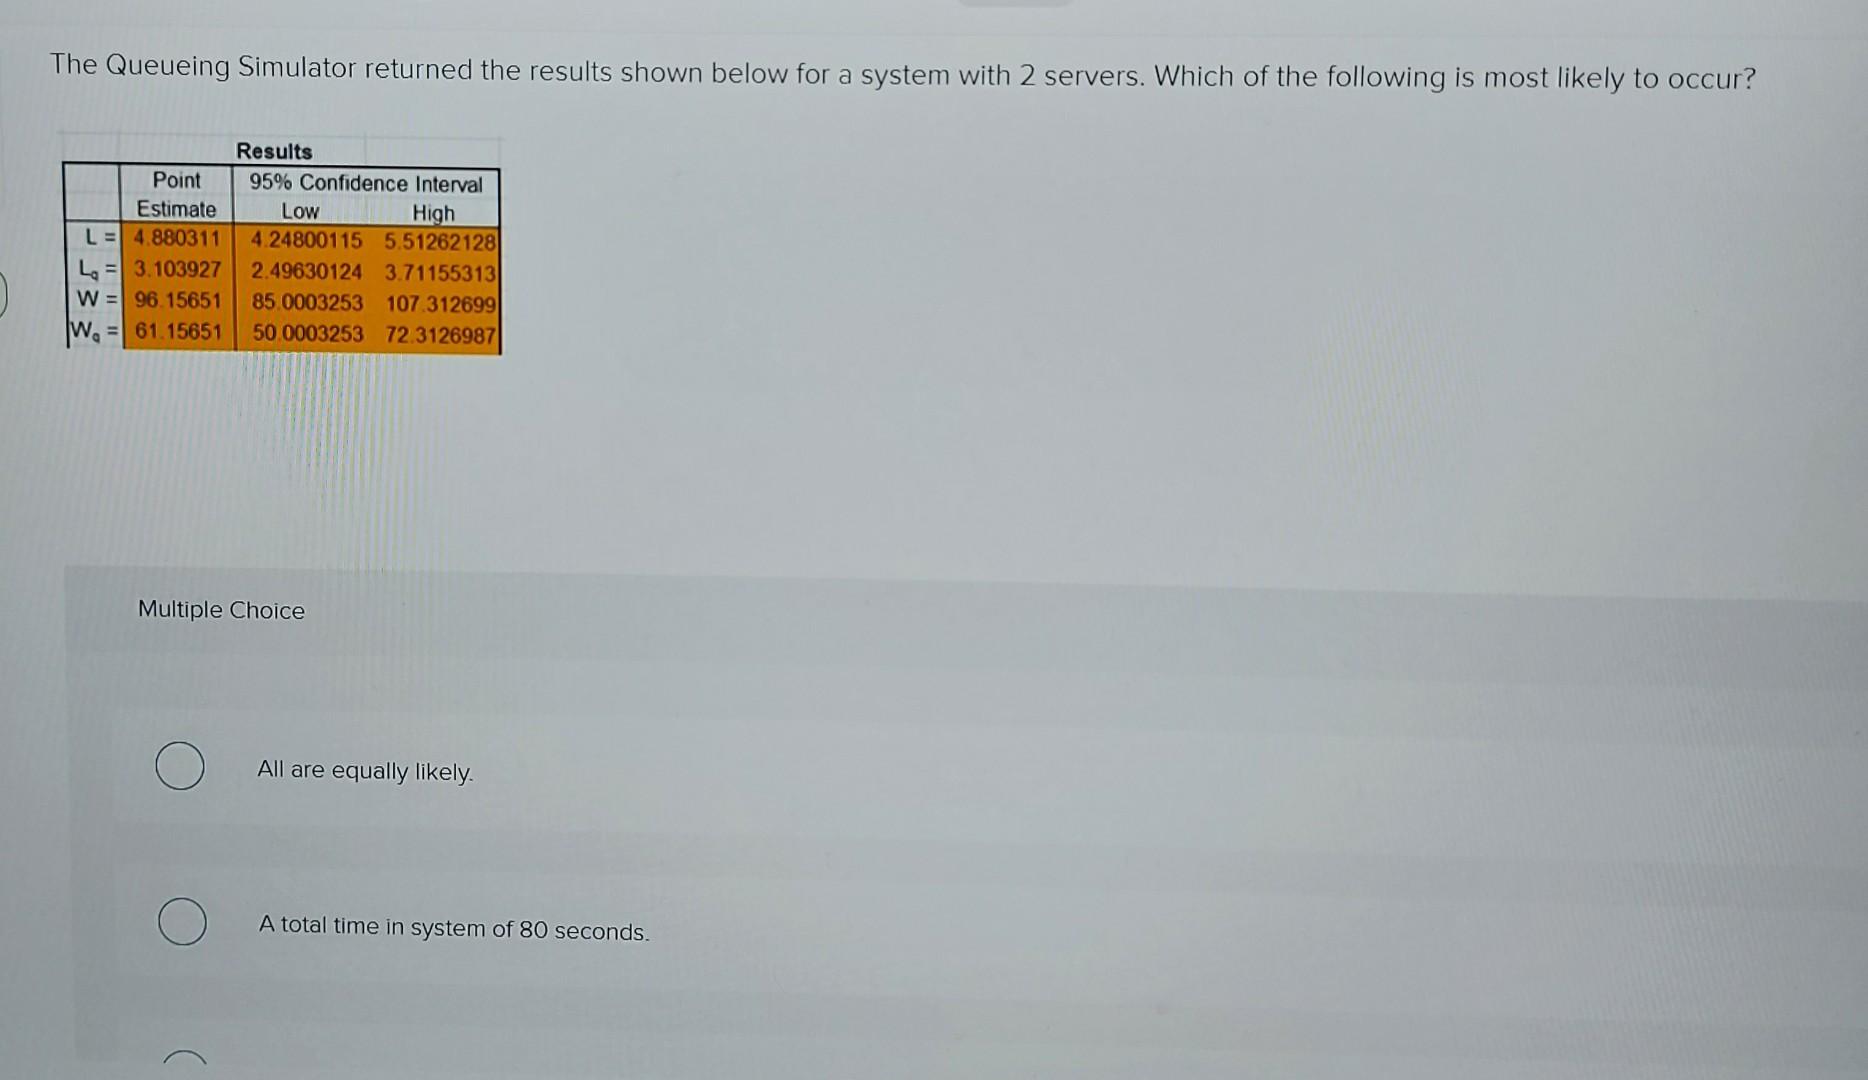
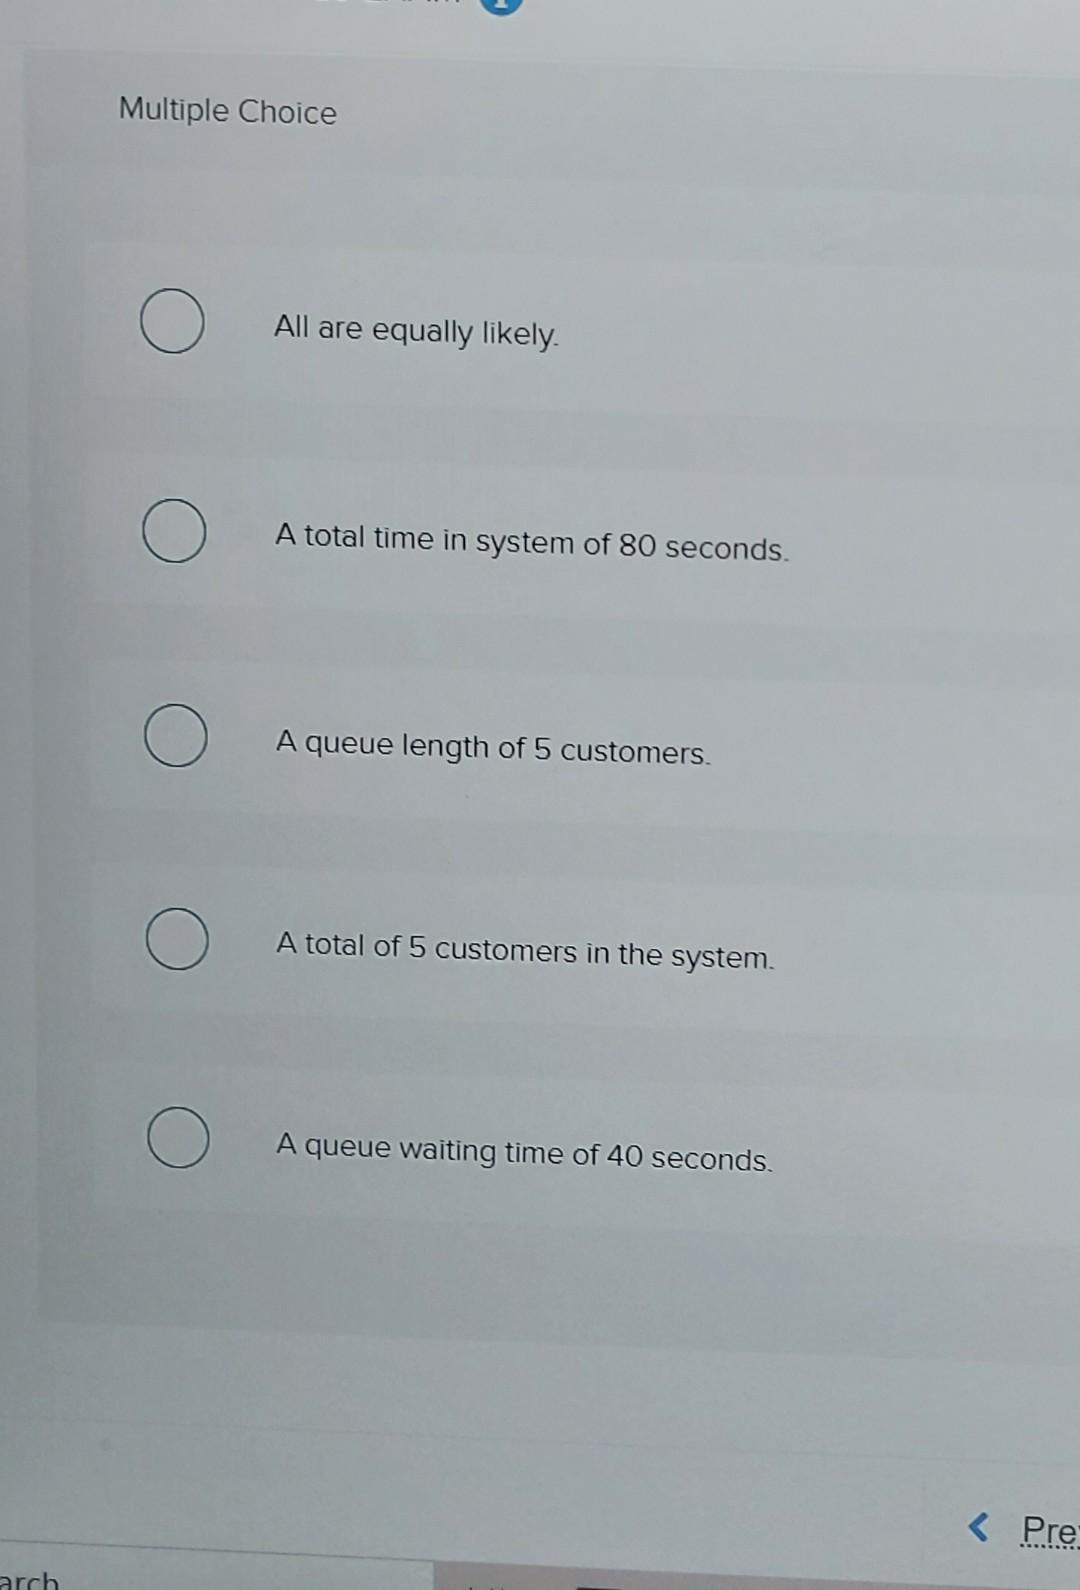
The Queueing Simulator returned the results shown below for a system with 2 servers. Which of the following is most likely to occur? Results Point 95% Confidence Interval Estimate LOW High L = 4.880311 4.24800115 5.51262128) L = 3.103927 2.49630124 3.71155313 W = 96.15651 85.0003253 107.312699 W. = = 61.15651 50.0003253 72.3126987 Multiple Choice All are equally likely A total time in system of 80 seconds. Multiple Choice All are equally likely. A total time in system of 80 seconds. A queue length of 5 customers. A total of 5 customers in the system. A queue waiting time of 40 seconds.
Step by Step Solution
There are 3 Steps involved in it
1 Expert Approved Answer
Step: 1 Unlock

Question Has Been Solved by an Expert!
Get step-by-step solutions from verified subject matter experts
Step: 2 Unlock
Step: 3 Unlock