

Question: The R Program code https://www.dropbox.com/s/bjc8nfhf9b0mh4l/TheStrengthofWeakTiesC1983.pdf?dl=0 https://www.dropbox.com/s/rtrq7wk0qjf11jk/lesmiserables.gml?dl=0 One premise of the Strength of Weak Tie theory is that, the stronger the tie between two people is,
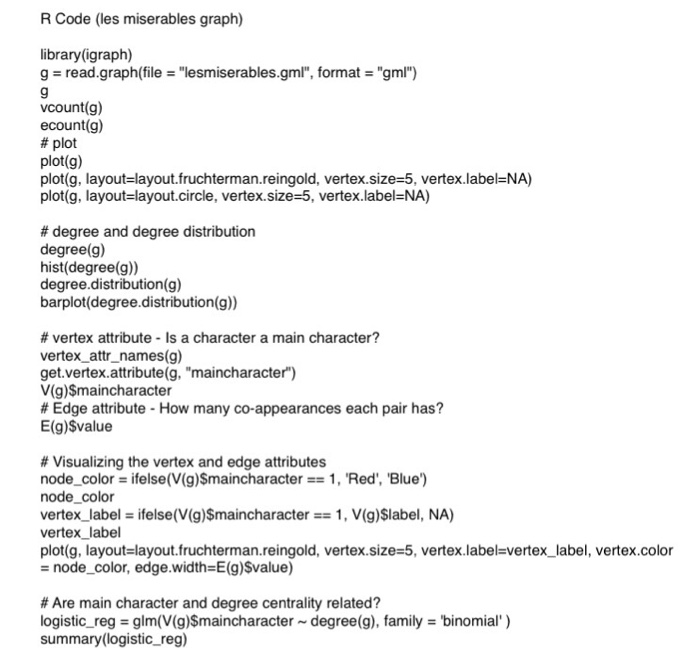
The R Program code
https://www.dropbox.com/s/bjc8nfhf9b0mh4l/TheStrengthofWeakTiesC1983.pdf?dl=0
https://www.dropbox.com/s/rtrq7wk0qjf11jk/lesmiserables.gml?dl=0
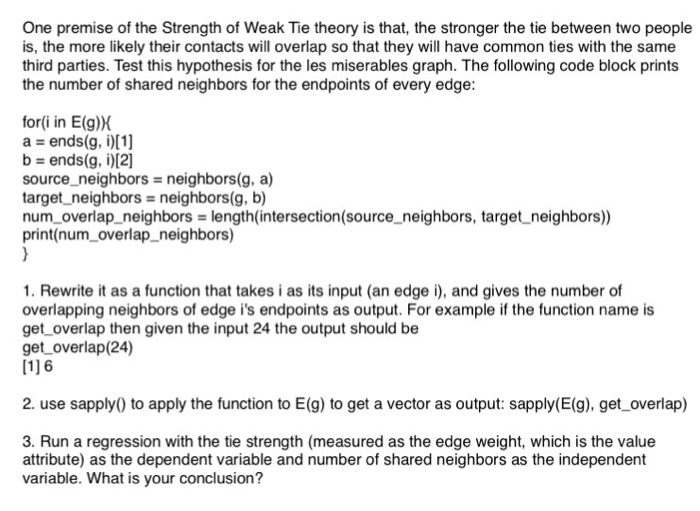
One premise of the Strength of Weak Tie theory is that, the stronger the tie between two people is, the more likely their contacts will overlap so that they will have common ties with the same third parties. Test this hypothesis for the les miserables graph. The following code blockprints the number of shared neighbors for the endpoints of every edge: forti in E(g)X a ends(g, i)[1] b ends (g, i)[2] source neighbors neighbors(g, a) target neighbors neighbors(g, b) num overlap neighbors ength intersection(source neighbors, target neighbors) print (num overlap neighbors) 1. Rewrite it as a function that takes i as its input (an edge and gives the number of overlapping neighbors of edge is endpoints as output. For example if the function name is get overlap then given the input 24 the output should be get overlap(24) [116 2. use sapply0 to apply the function to E(g) to get a vector as output: sapply(E(g), get overlap) 3. Run a regression with the tie strength (measured as the edge weight, which is the value attribute) as the dependent variable and number of shared neighbors as the independent variable. What is your conclusion? One premise of the Strength of Weak Tie theory is that, the stronger the tie between two people is, the more likely their contacts will overlap so that they will have common ties with the same third parties. Test this hypothesis for the les miserables graph. The following code blockprints the number of shared neighbors for the endpoints of every edge: forti in E(g)X a ends(g, i)[1] b ends (g, i)[2] source neighbors neighbors(g, a) target neighbors neighbors(g, b) num overlap neighbors ength intersection(source neighbors, target neighbors) print (num overlap neighbors) 1. Rewrite it as a function that takes i as its input (an edge and gives the number of overlapping neighbors of edge is endpoints as output. For example if the function name is get overlap then given the input 24 the output should be get overlap(24) [116 2. use sapply0 to apply the function to E(g) to get a vector as output: sapply(E(g), get overlap) 3. Run a regression with the tie strength (measured as the edge weight, which is the value attribute) as the dependent variable and number of shared neighbors as the independent variable. What is your conclusion
Step by Step Solution
There are 3 Steps involved in it

Get step-by-step solutions from verified subject matter experts