

Question: The ratios that we discussed in this chapter are ratio analysis of balance sheet and income statement, financial ratio, liquidity ratios, asset management ratios, financial
The ratios that we discussed in this chapter are ratio analysis of balance sheet and income statement, financial ratio, liquidity ratios, asset management ratios, financial leverage ratios, profitability ratios, and market value ratios
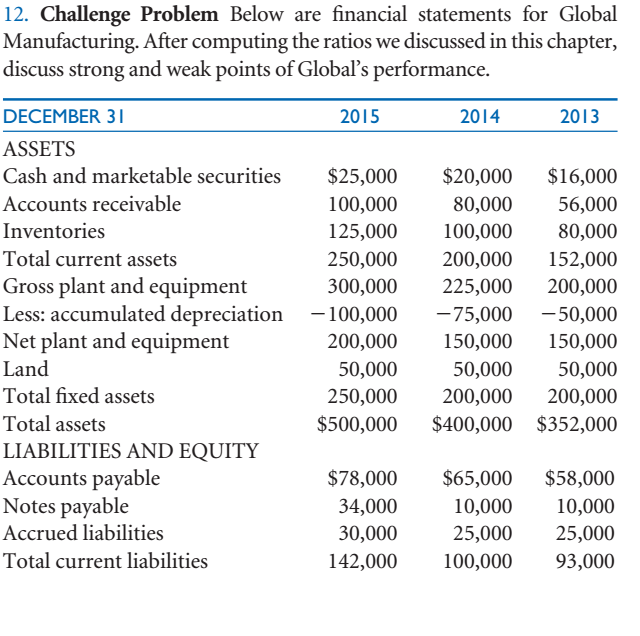

12. Challenge Problem Below are financial statements for Global Manufacturing. After computing the ratios we discussed in this chapter, discuss strong and weak points of Global's performance. 2013 DECEMBER 31 2015 2014 ASSETS Cash and marketable securities $25,000 $20,000 $16,000 Accounts receivable 100,000 80,000 56,000 Inventories 125,000 100,000 80,000 Total current assets 250,000 200,000 152,000 Gross plant and equipment Less: accumulated depreciation Net plant and equipment 300,000 225,000 200,000 -100,000 -75,000 -50,000 200,000 150,000 150,000 Land 50,000 50,000 50,000 Total fixed assets 250,000 200,000 200,000 Total assets $500,000 $400,000 $352,000 LIABILITIES AND EQUITY Accounts payable Notes payable $58,000 $78,000 $65,000 34,000 10,000 10,000 Accrued liabilities 30,000 25,000 25,000 Total current liabilities 142,000 100,000 93,000 DECEMBER 3 Long-term debt 2015 2014 2013 140,000 100,000 71,000 Total liabilities $282,000 $200,000 $164,000 Common stock ($1 par, 50,000 shares) Paid-in capital Retained earnings Total stockholders' equity Total liabilities and equity $50,000 $50,000 $50,000 100,000 100,000 100,000 68,000 50,000 38,000 218,000 200,000 188,000 $500,000 $400,000 $352,000 2015 YEARS ENDED DECEMBER 31 2014 2013 Net revenues or sales $700,000 $600,000 $540,000 Cost of goods sold Gross profit Operating expenses: 450,000 375,000 338,000 250,000 225,000 202,000 General and administrative 95,000 95,000 95,000 Selling and marketing Depreciation Operating income 56,000 50,000 45,000 20,000 25,000 15,000 74,000 60,000 47,000 Interest 14,000 7,000 10,000 Income before taxes 60,000 50,000 40,000 Income taxes (40%) 20,000 $30,000 16,000 24,000 $36,000 $24,000 Net income Number of shares outstanding Earnings per share 50,000 50,000 50,000 $0.72 $0.48 $0.60
Step by Step Solution
There are 3 Steps involved in it

Get step-by-step solutions from verified subject matter experts