

Question: The Rcode below, simulates this data where the x variable is AZT dose in mg/day and y is mean weight gain in pounds. Enter the
The Rcode below, simulates this data where the x variable is AZT dose in mg/day and y is mean weight gain in pounds.
Enter the Rcode below, exactly as it is given and in top-down fashion. 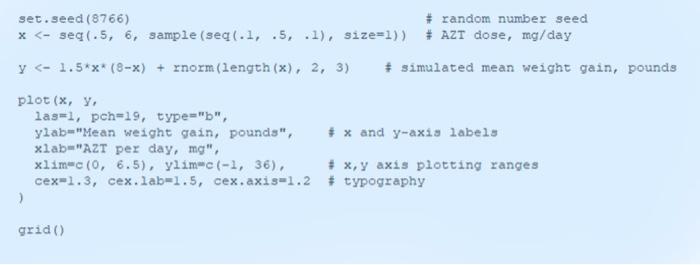
A. Use the Rcode above for a publication quality, point and line graph
Step by Step Solution
There are 3 Steps involved in it
1 Expert Approved Answer
Step: 1 Unlock

Question Has Been Solved by an Expert!
Get step-by-step solutions from verified subject matter experts
Step: 2 Unlock
Step: 3 Unlock