

Question: The rectangles in the graph below illustrate a left endpoint Riemann sum for f(x) The value of this left endpoint Riemann sum is enclosed
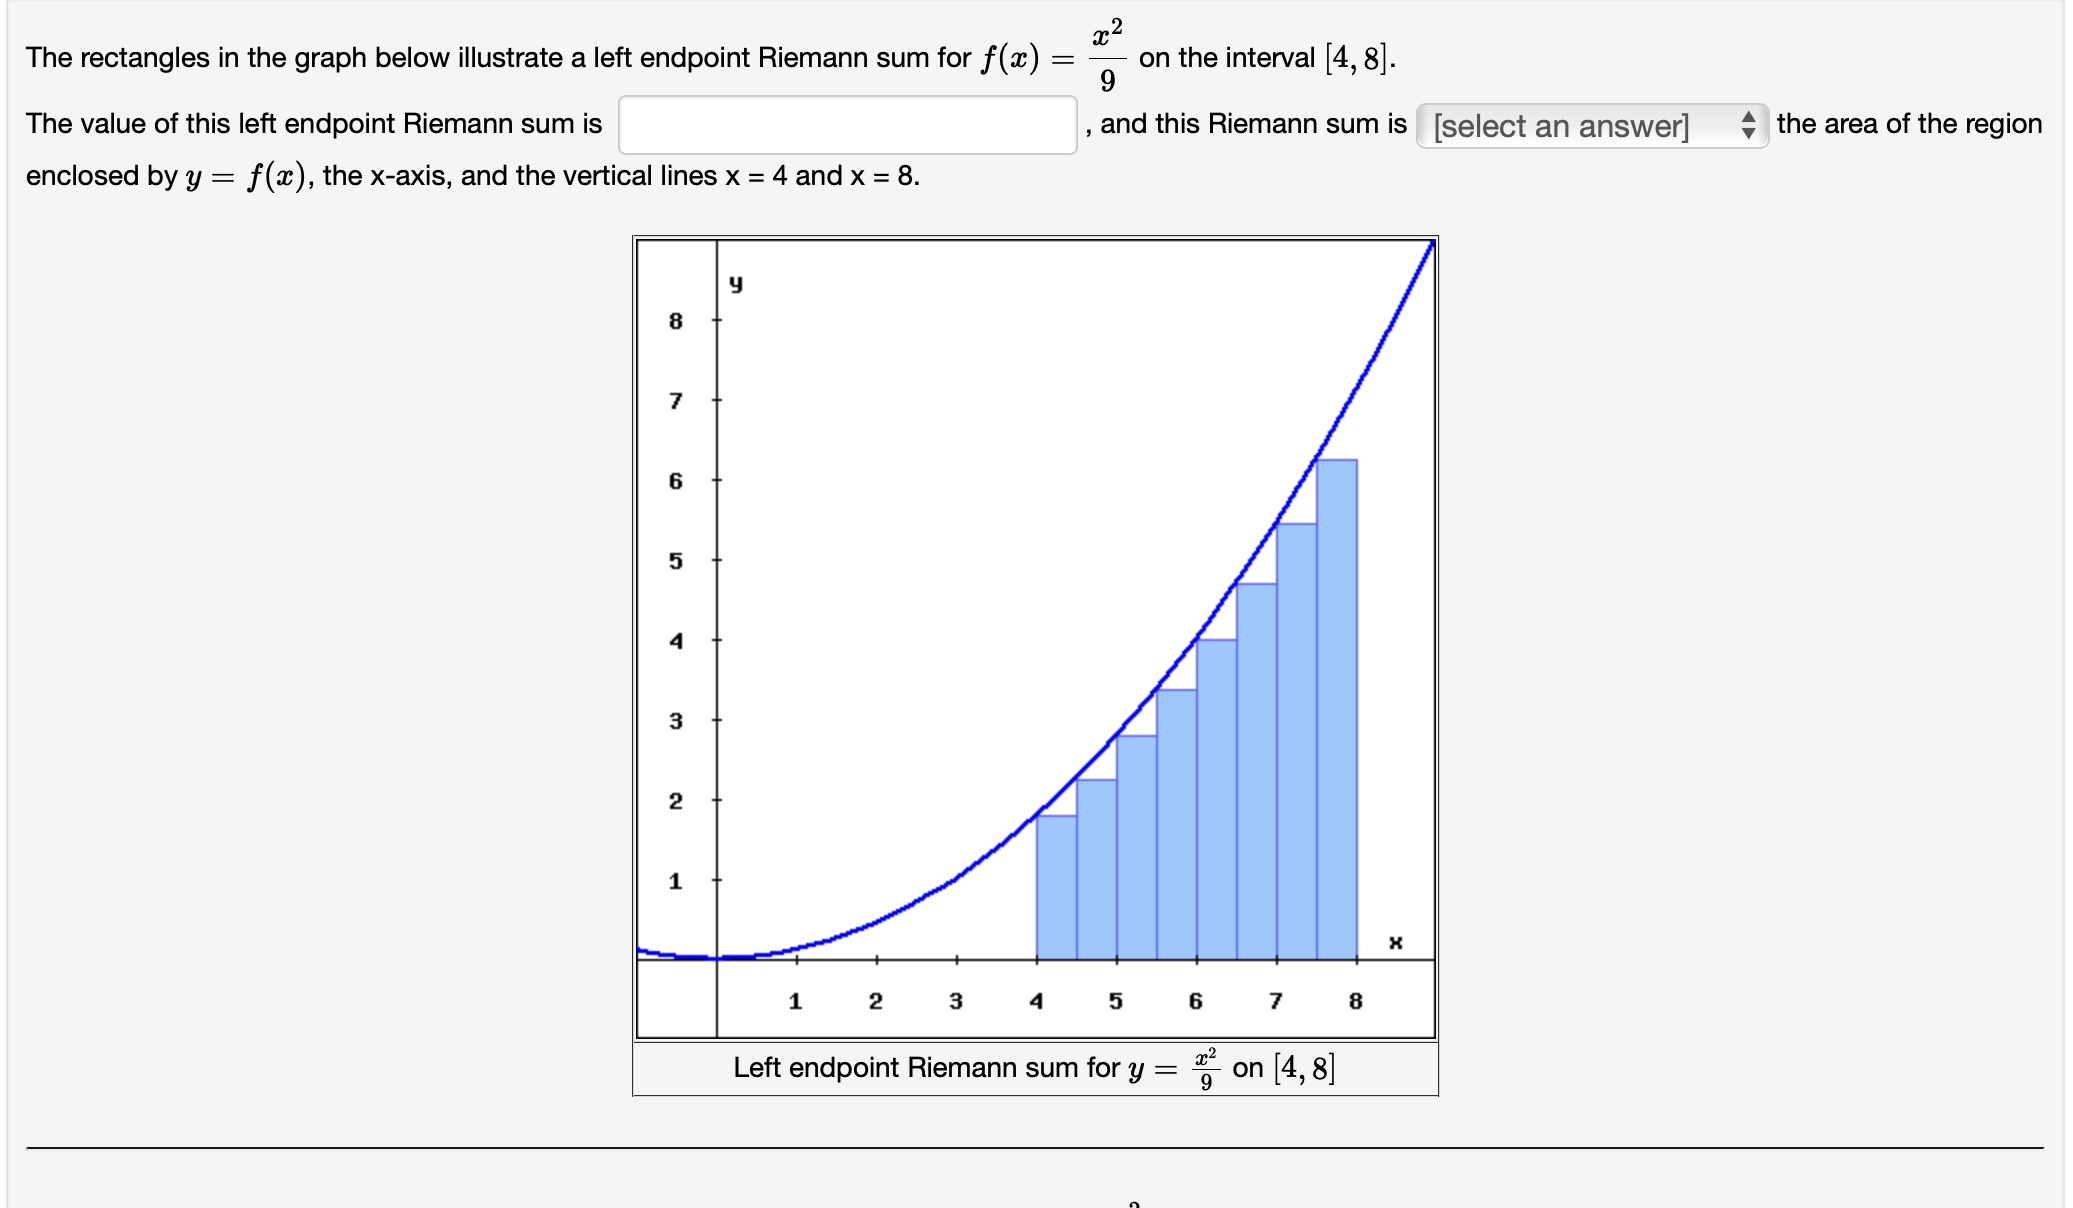
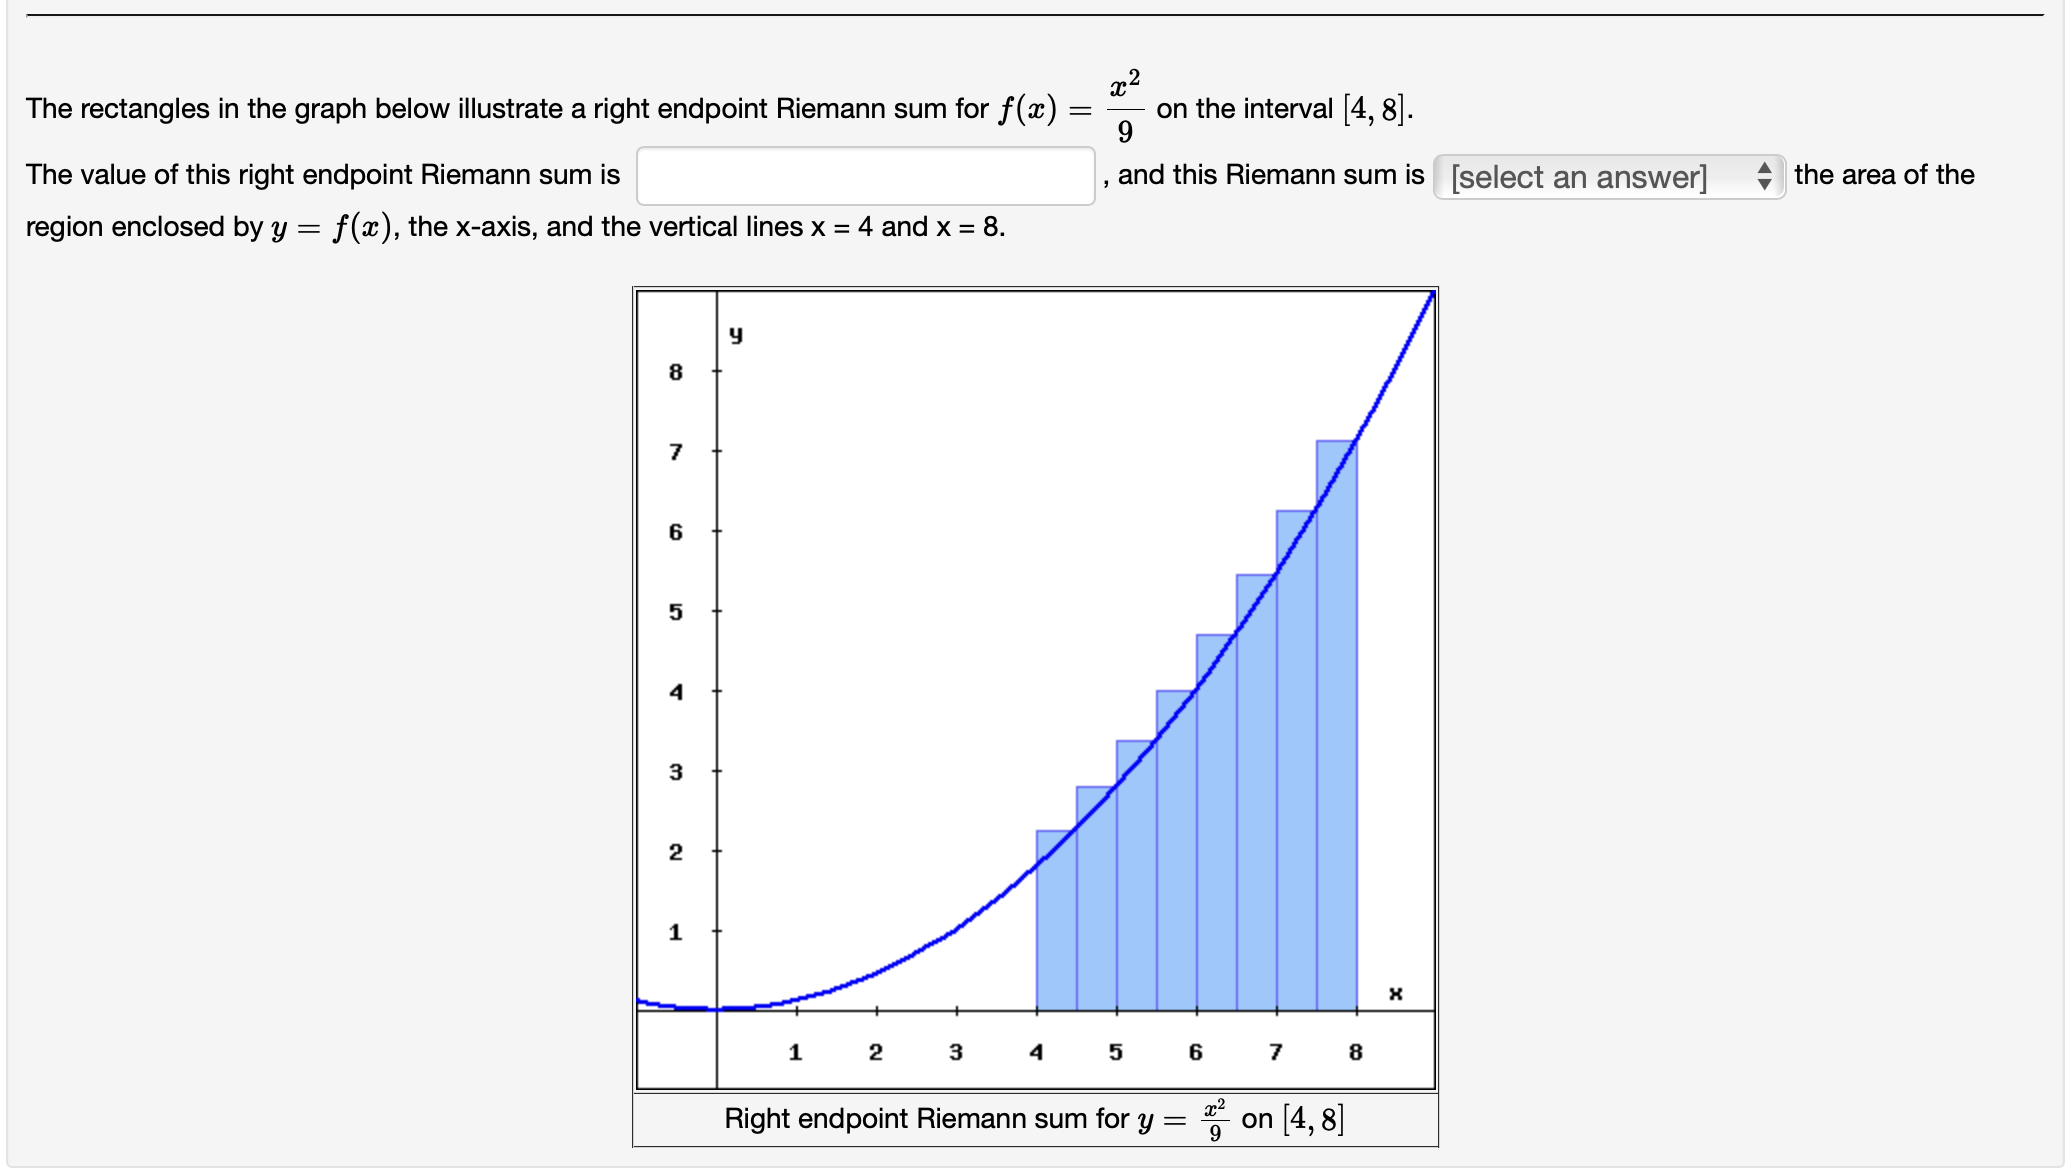
The rectangles in the graph below illustrate a left endpoint Riemann sum for f(x) The value of this left endpoint Riemann sum is enclosed by y = f(x), the x-axis, and the vertical lines x = 4 and x = 8. 8 7 16 5 4 3 2 1 x2 == on the interval [4,8]. 9 and this Riemann sum is [select an answer] the area of the region 1 2 3 4 56 7 8 x2 Left endpoint Riemann sum for = 9 on [4,8] * The rectangles in the graph below illustrate a right endpoint Riemann sum for f(x): The value of this right endpoint Riemann sum is region enclosed by y = f(x), the x-axis, and the vertical lines x = 4 and x = 8. 8 7 6 5 4 3 2 1 x2 = on the interval [4,8]. 9 and this Riemann sum is [select an answer] the area of the 1 2 3 4-5-6-78 Right endpoint Riemann sum for x2 y = on [4,8] 9 *
Step by Step Solution
There are 3 Steps involved in it

Get step-by-step solutions from verified subject matter experts