

Question: The rectangles in the graph below illustrate a left endpoint Riemann sum for f(x) = (17/x) on the interval [2,6]. The value of this
![for f(x) = (17/x) on the interval [2,6]. The value of this](https://s3.amazonaws.com/si.experts.images/answers/2024/05/6647ab9066eee_0086647ab90481ac.jpg)
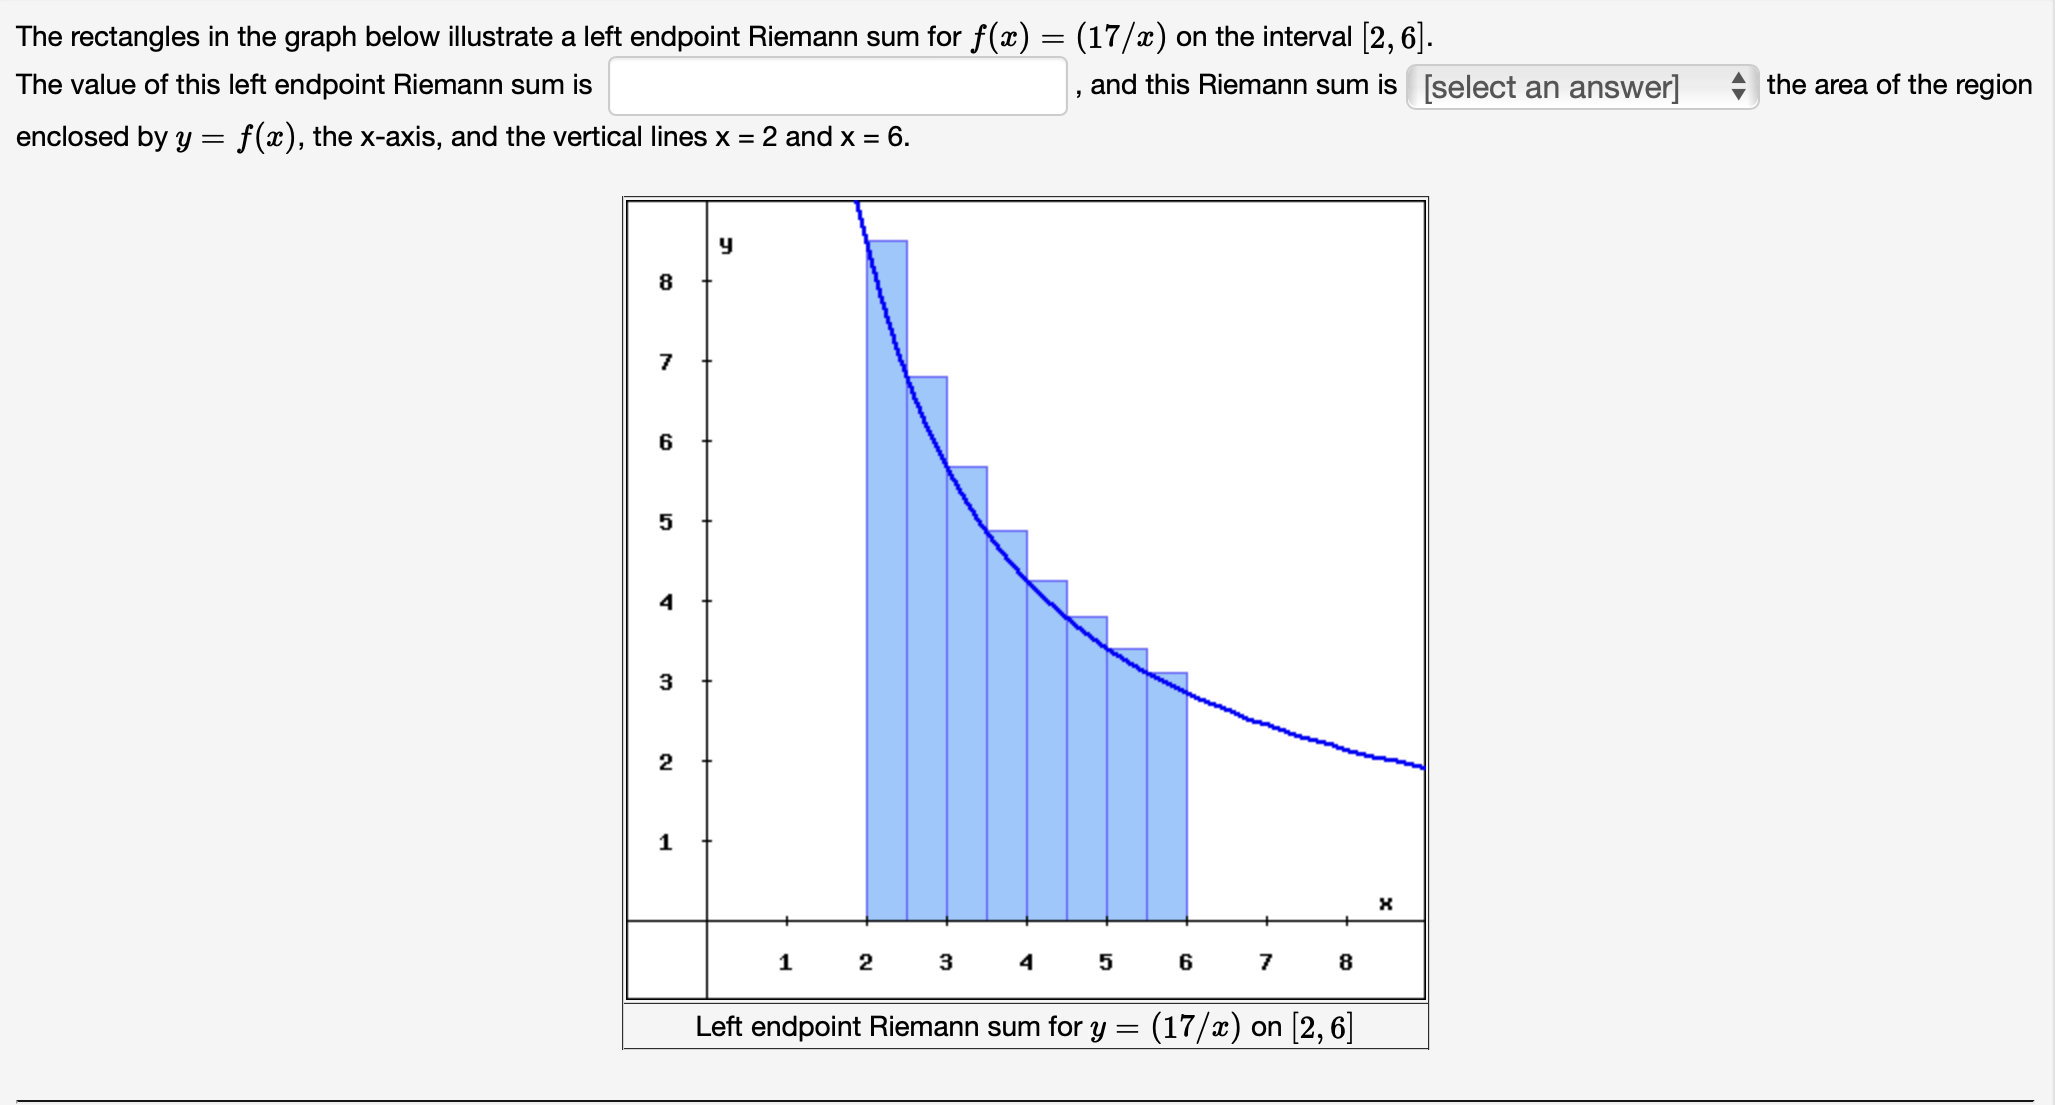
The rectangles in the graph below illustrate a left endpoint Riemann sum for f(x) = (17/x) on the interval [2,6]. The value of this left endpoint Riemann sum is enclosed by y = f(x), the x-axis, and the vertical lines x = 2 and x = 6. ' and this Riemann sum is [select an answer] the area of the region 7 6 5 3 2 1 1 2 3 4 56 7 8 Left endpoint Riemann sum for y = (17/x) on [2,6] * The rectangles in the graph below illustrate a right endpoint Riemann sum for f(x) = (17/x) on the interval [2,6]. The value of this right endpoint Riemann sum is ' and this Riemann sum is [select an answer] the area of the region enclosed by y = f(x), the x-axis, and the vertical lines x = 2 and x = 6. 00 8 7 6 5 4 3 2 1 1 2 3 4 56 7 8 Right endpoint Riemann sum for y = (17/x) on [2,6] *
Step by Step Solution
There are 3 Steps involved in it

Get step-by-step solutions from verified subject matter experts