

Question: ***The regression chart I have created. Also everything has been provided Purpose: The purpose of this analysis homework is to stimulate active learning and develop
***The regression chart I have created. Also everything has been provided
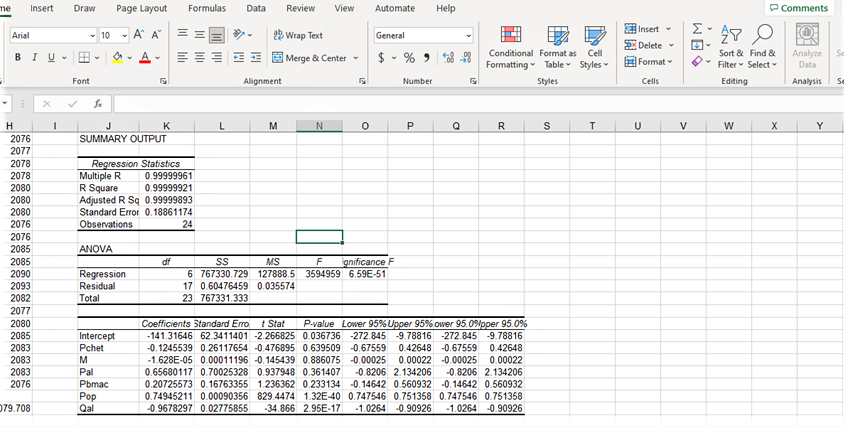
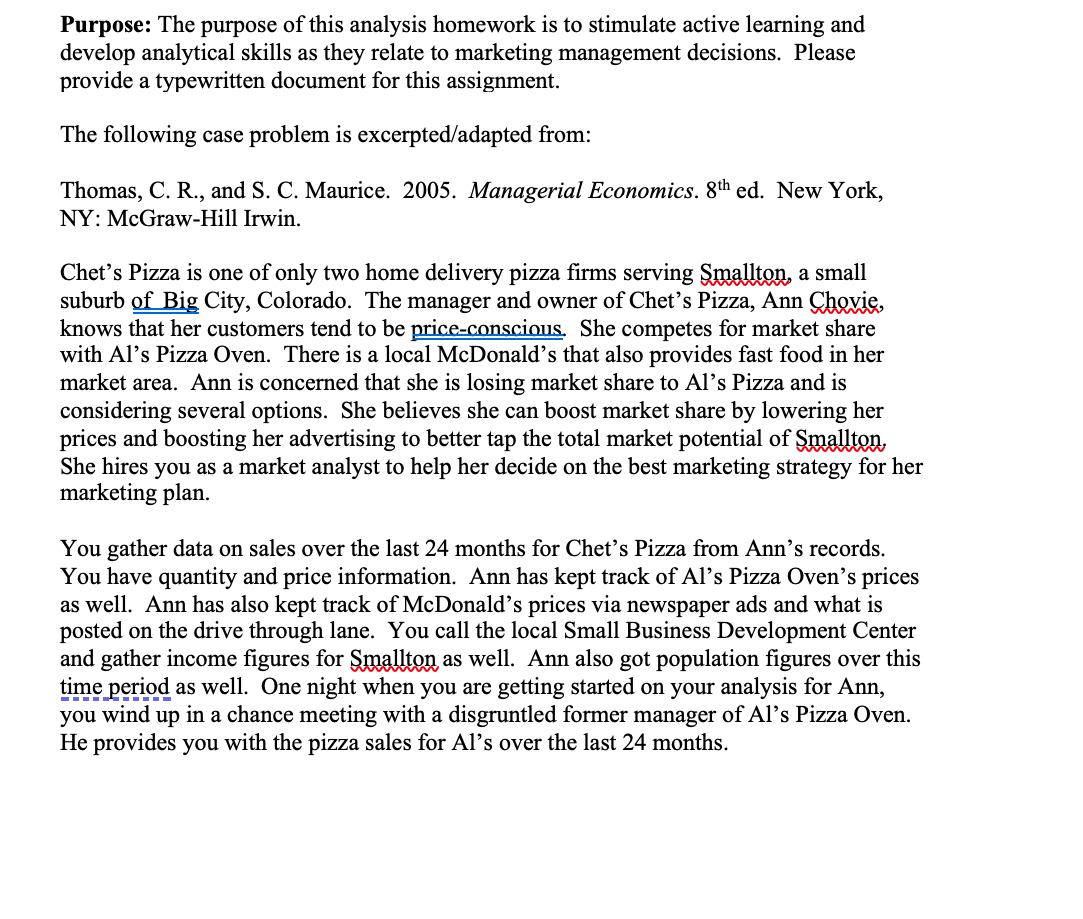
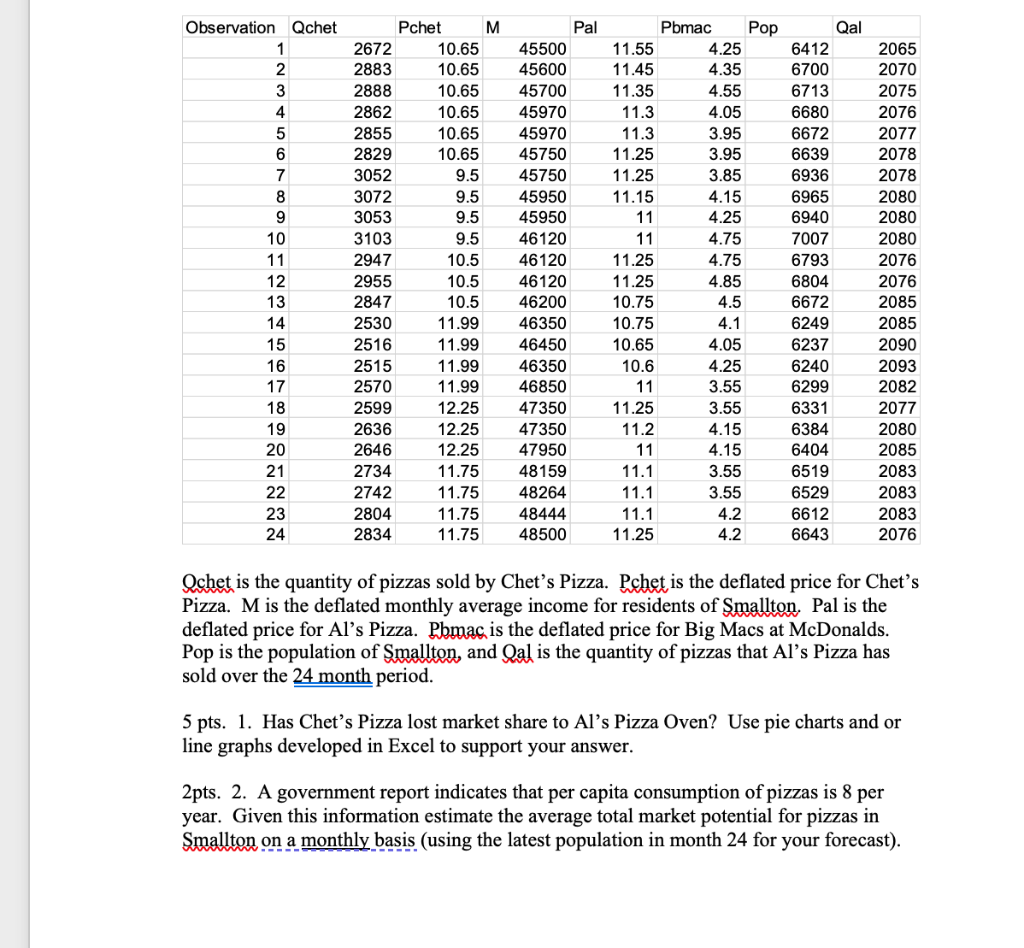
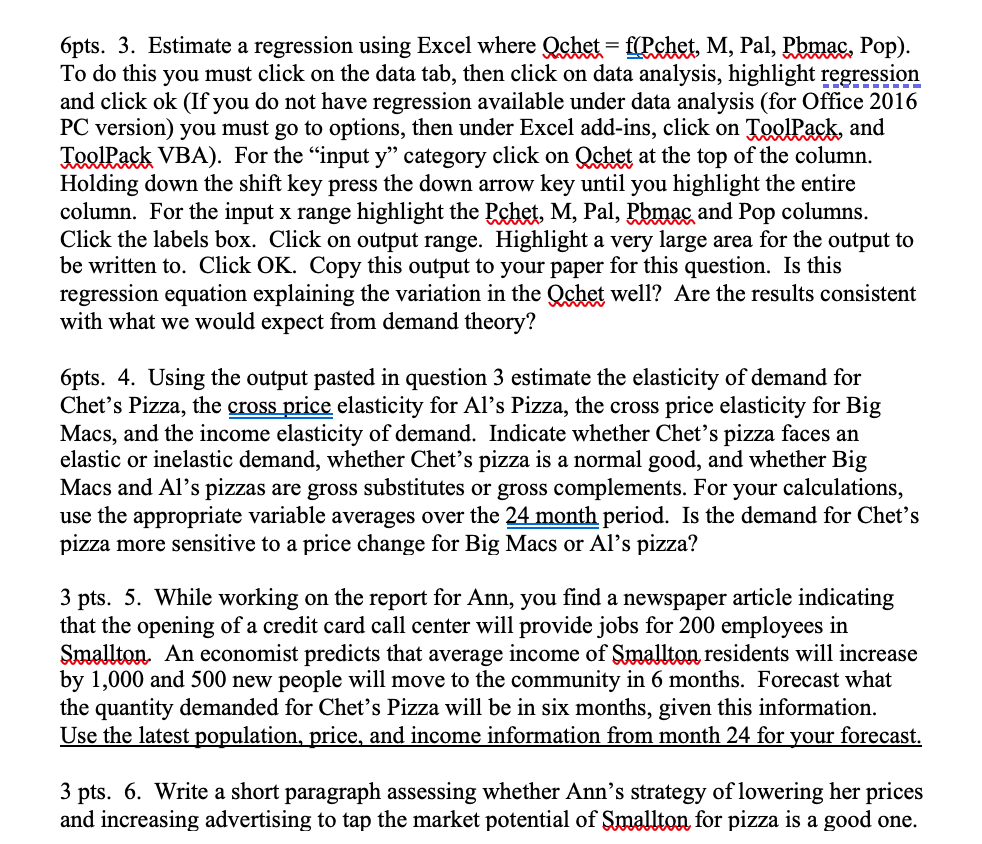
Purpose: The purpose of this analysis homework is to stimulate active learning and develop analytical skills as they relate to marketing management decisions. Please provide a typewritten document for this assignment. The following case problem is excerpted/adapted from: Thomas, C. R., and S. C. Maurice. 2005. Managerial Economics. 8th ed. New York, NY: McGraw-Hill Irwin. Chet's Pizza is one of only two home delivery pizza firms serving Smallton a small suburb of Big City, Colorado. The manager and owner of Chet's Pizza, Ann Chovie, knows that her customers tend to be price-conscious. She competes for market share with Al's Pizza Oven. There is a local McDonald's that also provides fast food in her market area. Ann is concerned that she is losing market share to Al's Pizza and is considering several options. She believes she can boost market share by lowering her prices and boosting her advertising to better tap the total market potential of Smallton She hires you as a market analyst to help her decide on the best marketing strategy for her marketing plan. You gather data on sales over the last 24 months for Chet's Pizza from Ann's records. You have quantity and price information. Ann has kept track of Al's Pizza Oven's prices as well. Ann has also kept track of McDonald's prices via newspaper ads and what is posted on the drive through lane. You call the local Small Business Development Center and gather income figures for Smallton as well. Ann also got population figures over this time period as well. One night when you are getting started on your analysis for Ann, you wind up in a chance meeting with a disgruntled former manager of Al's Pizza Oven. He provides you with the pizza sales for Al's over the last 24 months. Qchet is the quantity of pizzas sold by Chet's Pizza. Pchet is the deflated price for Chet's Pizza. M is the deflated monthly average income for residents of Smallton. Pal is the deflated price for Al's Pizza. Pbmac is the deflated price for Big Macs at McDonalds. Pop is the population of Smallton, and Qal is the quantity of pizzas that Al's Pizza has sold over the 24 month period. 5 pts. 1. Has Chet's Pizza lost market share to Al's Pizza Oven? Use pie charts and or line graphs developed in Excel to support your answer. 2 pts. 2. A government report indicates that per capita consumption of pizzas is 8 per year. Given this information estimate the average total market potential for pizzas in Smallton on a monthly basis (using the latest population in month 24 for your forecast). 6pts. 3. Estimate a regression using Excel where Qchet = f(Pchet, M, Pal, Pbmac, Pop). To do this you must click on the data tab, then click on data analysis, highlight regression and click ok (If you do not have regression available under data analysis (for Office 2016 PC version) you must go to options, then under Excel add-ins, click on ToolPack, and Tooltack VBA). For the "input y" category click on Qchet at the top of the column. Holding down the shift key press the down arrow key until you highlight the entire column. For the input x range highlight the Pchet, M, Pal, Pbmac and Pop columns. Click the labels box. Click on output range. Highlight a very large area for the output to be written to. Click OK. Copy this output to your paper for this question. Is this regression equation explaining the variation in the Qchet well? Are the results consistent with what we would expect from demand theory? 6 pts. 4. Using the output pasted in question 3 estimate the elasticity of demand for Chet's Pizza, the cross price elasticity for Al's Pizza, the cross price elasticity for Big Macs, and the income elasticity of demand. Indicate whether Chet's pizza faces an elastic or inelastic demand, whether Chet's pizza is a normal good, and whether Big Macs and Al's pizzas are gross substitutes or gross complements. For your calculations, use the appropriate variable averages over the 24 month period. Is the demand for Chet's pizza more sensitive to a price change for Big Macs or Al's pizza? 3 pts. 5. While working on the report for Ann, you find a newspaper article indicating that the opening of a credit card call center will provide jobs for 200 employees in Smallton. An economist predicts that average income of Smallton residents will increase by 1,000 and 500 new people will move to the community in 6 months. Forecast what the quantity demanded for Chet's Pizza will be in six months, given this information. Use the latest population, price, and income information from month 24 for your forecast. 3 pts. 6. Write a short paragraph assessing whether Ann's strategy of lowering her prices and increasing advertising to tap the market potential of Smallton for pizza is a good one. Purpose: The purpose of this analysis homework is to stimulate active learning and develop analytical skills as they relate to marketing management decisions. Please provide a typewritten document for this assignment. The following case problem is excerpted/adapted from: Thomas, C. R., and S. C. Maurice. 2005. Managerial Economics. 8th ed. New York, NY: McGraw-Hill Irwin. Chet's Pizza is one of only two home delivery pizza firms serving Smallton a small suburb of Big City, Colorado. The manager and owner of Chet's Pizza, Ann Chovie, knows that her customers tend to be price-conscious. She competes for market share with Al's Pizza Oven. There is a local McDonald's that also provides fast food in her market area. Ann is concerned that she is losing market share to Al's Pizza and is considering several options. She believes she can boost market share by lowering her prices and boosting her advertising to better tap the total market potential of Smallton She hires you as a market analyst to help her decide on the best marketing strategy for her marketing plan. You gather data on sales over the last 24 months for Chet's Pizza from Ann's records. You have quantity and price information. Ann has kept track of Al's Pizza Oven's prices as well. Ann has also kept track of McDonald's prices via newspaper ads and what is posted on the drive through lane. You call the local Small Business Development Center and gather income figures for Smallton as well. Ann also got population figures over this time period as well. One night when you are getting started on your analysis for Ann, you wind up in a chance meeting with a disgruntled former manager of Al's Pizza Oven. He provides you with the pizza sales for Al's over the last 24 months. Qchet is the quantity of pizzas sold by Chet's Pizza. Pchet is the deflated price for Chet's Pizza. M is the deflated monthly average income for residents of Smallton. Pal is the deflated price for Al's Pizza. Pbmac is the deflated price for Big Macs at McDonalds. Pop is the population of Smallton, and Qal is the quantity of pizzas that Al's Pizza has sold over the 24 month period. 5 pts. 1. Has Chet's Pizza lost market share to Al's Pizza Oven? Use pie charts and or line graphs developed in Excel to support your answer. 2 pts. 2. A government report indicates that per capita consumption of pizzas is 8 per year. Given this information estimate the average total market potential for pizzas in Smallton on a monthly basis (using the latest population in month 24 for your forecast). 6pts. 3. Estimate a regression using Excel where Qchet = f(Pchet, M, Pal, Pbmac, Pop). To do this you must click on the data tab, then click on data analysis, highlight regression and click ok (If you do not have regression available under data analysis (for Office 2016 PC version) you must go to options, then under Excel add-ins, click on ToolPack, and Tooltack VBA). For the "input y" category click on Qchet at the top of the column. Holding down the shift key press the down arrow key until you highlight the entire column. For the input x range highlight the Pchet, M, Pal, Pbmac and Pop columns. Click the labels box. Click on output range. Highlight a very large area for the output to be written to. Click OK. Copy this output to your paper for this question. Is this regression equation explaining the variation in the Qchet well? Are the results consistent with what we would expect from demand theory? 6 pts. 4. Using the output pasted in question 3 estimate the elasticity of demand for Chet's Pizza, the cross price elasticity for Al's Pizza, the cross price elasticity for Big Macs, and the income elasticity of demand. Indicate whether Chet's pizza faces an elastic or inelastic demand, whether Chet's pizza is a normal good, and whether Big Macs and Al's pizzas are gross substitutes or gross complements. For your calculations, use the appropriate variable averages over the 24 month period. Is the demand for Chet's pizza more sensitive to a price change for Big Macs or Al's pizza? 3 pts. 5. While working on the report for Ann, you find a newspaper article indicating that the opening of a credit card call center will provide jobs for 200 employees in Smallton. An economist predicts that average income of Smallton residents will increase by 1,000 and 500 new people will move to the community in 6 months. Forecast what the quantity demanded for Chet's Pizza will be in six months, given this information. Use the latest population, price, and income information from month 24 for your forecast. 3 pts. 6. Write a short paragraph assessing whether Ann's strategy of lowering her prices and increasing advertising to tap the market potential of Smallton for pizza is a good one
Step by Step Solution
There are 3 Steps involved in it

Get step-by-step solutions from verified subject matter experts