

Question: The regression output below is incomplete. The data is gasoline per licensed driver as a function of the real gasoline price per gallon from 1949
The regression output below is incomplete. The data is gasoline per licensed driver as a function of the real gasoline price per gallon from 1949 to 2016.
The functional format is set up as a nonlinear model by taking the natural logarithm of both annual gasoline per licensed driver and annual real gasoline price per gallon from 1949 to 2016 for the United States.
Log Gasoline per driver = Log 0
- Log 1
Real Price
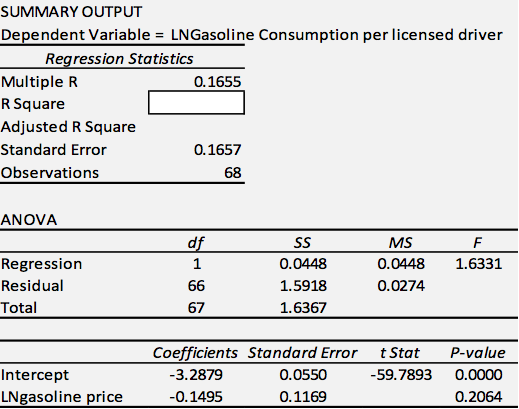
SUMMARY OUTPUT Dependent Variable = LN Gasoline Consumption per licensed driver Regression Statistics Multiple R 0. 1655 A Square Adjusted R Square* Standard Error 0. 1657 Observations 89 ANOVA OF 5.5 MIS F Regression 0. 04 48 0 . 0448 1. 6331 Residual 9.9 1. 5918 0. 0274 Total 67 1. 5357 Coefficients Standard Error I Stat P-value Intercept - 3. 2879 0. 0550 -59. 7893 0. 0000 LNgasoline price -0. 1495 0. 1 165 0. 2064
Step by Step Solution
There are 3 Steps involved in it

Get step-by-step solutions from verified subject matter experts