

Question: The regression output is provided below with corresponding standard errors in parentheses kids = -7.731 +0.1974 -0.09y76 -0.0678 -0.08y80 -0.42y82 -0.65y84 -0.135educ +0.277age -0.0055age? +0.88black
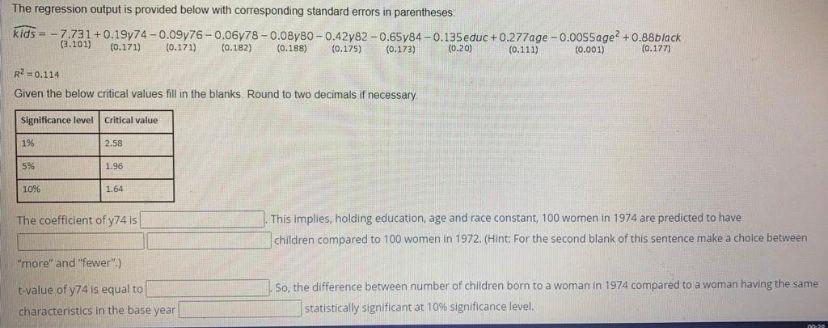
The regression output is provided below with corresponding standard errors in parentheses kids = -7.731 +0.1974 -0.09y76 -0.0678 -0.08y80 -0.42y82 -0.65y84 -0.135educ +0.277age -0.0055age? +0.88black (1.101) (0.171) (0.171) (0.182) (0.188) (0.175) (0.173) (0.20) (0.111) (0.001) (0.177) R?=0.114 Given the below critical values fill in the blanks Round to two decimals if necessary Significance level Critical value 1% se 2.58 5% 1.96 1096 1.64 The coefficient of y741s This implies, holding education age and race constant, 100 women in 1974 are predicted to have children compared to 100 women in 1972. (Hint For the second blank of this sentence make a cholce between "more" and "fewer") t value of y74 is equal to characteristics in the base year So, the difference between number of children born to a woman in 1974 compared to a woman having the same statistically significant at 10% significance level. The regression output is provided below with corresponding standard errors in parentheses kids = -7.731 +0.1974 -0.09y76 -0.0678 -0.08y80 -0.42y82 -0.65y84 -0.135educ +0.277age -0.0055age? +0.88black (1.101) (0.171) (0.171) (0.182) (0.188) (0.175) (0.173) (0.20) (0.111) (0.001) (0.177) R?=0.114 Given the below critical values fill in the blanks Round to two decimals if necessary Significance level Critical value 1% se 2.58 5% 1.96 1096 1.64 The coefficient of y741s This implies, holding education age and race constant, 100 women in 1974 are predicted to have children compared to 100 women in 1972. (Hint For the second blank of this sentence make a cholce between "more" and "fewer") t value of y74 is equal to characteristics in the base year So, the difference between number of children born to a woman in 1974 compared to a woman having the same statistically significant at 10% significance level
Step by Step Solution
There are 3 Steps involved in it

Get step-by-step solutions from verified subject matter experts