

Question: the requier is : You have to do 3 types of analysis first do horizontal analysis take one year and find out the other year
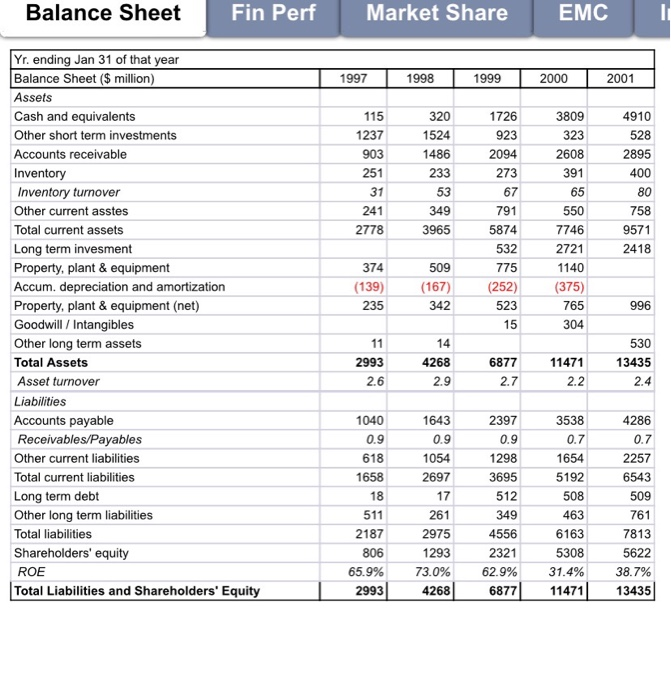
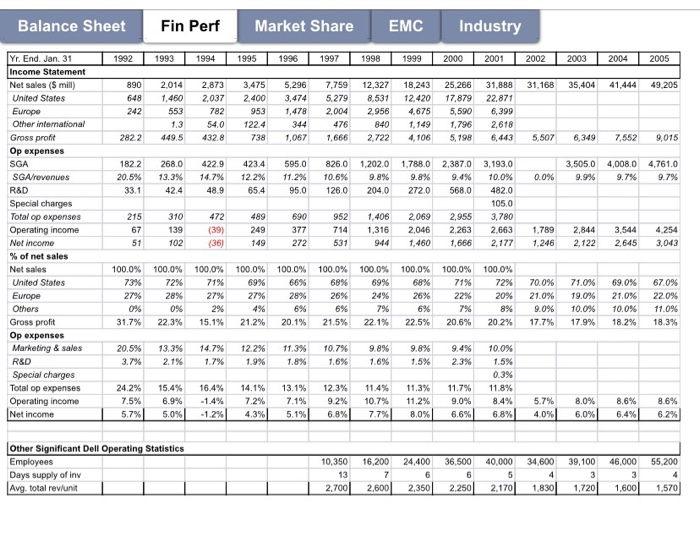
Balance Sheet Fin Perf Market Share EMC 1997 1998 1999 2000 2001 115 1237 903 251 320 1524 1486 233 53 349 3965 1726 923 2094 273 67 4910 528 2895 400 80 758 9571 2418 31 791 241 2778 3809 323 2608 391 65 550 7746 2721 1140 (375) 765 304 374 (139) 235 509 (167) 342 Yr. ending Jan 31 of that year Balance Sheet ($ million) Assets Cash and equivalents Other short term investments Accounts receivable Inventory Inventory turnover Other current asstes Total current assets Long term invesment Property, plant & equipment Accum. depreciation and amortization Property, plant & equipment (net) Goodwill / Intangibles Other long term assets Total Assets Asset turnover Liabilities Accounts payable Receivables/Payables Other current liabilities Total current liabilities Long term debt Other long term liabilities Total liabilities Shareholders' equity ROE Total Liabilities and Shareholders' Equity 5874 532 775 (252) 523 15 996 2993 2.6 14 4268 2.9 6877 2.7 11471 2.2 530 13435 2.4 4286 0.7 2257 6543 509 1040 1643 2397 0.9 0.9 0.9 618 1054 1298 1658 2697 3695 18 17 512 511 261 349 2187 2975 4556 806 1293 2321 65.9% 73.0% 62.9% 299342686877| 3538 0.7 1654 5192 508 463 6163 5308 31.4% 11471 761 7813 5622 38.7% 13435 Balance Sheet Fin Perf Market Share EMC Industry 1 1992 1993 1994 1995 1996 1997 1998 1999 2000 2001 2002 2003 2004 2005 31,168 35,404 41,444 49 205 890 648 242 2 2014 1,460 553 1.3 449.5 2.873 ,037 782 54.0 432. 8 3.4755 2.400 953 122.4 7 38 .296 3,474 1,478 344 1,067 7.759 5.279 2,004 476 1,666 12.327 8.531 2,956 840 2.722 18,243 12.420 4,675 1,149 4.106 25 266 17,879 5,590 1,796 5,198 31,888 22.871 6,399 2,618 6,443 282 2 5,5076,349 7,552 9,015 182.2 20.5% 33. 1 268. 0 13.3% 4 2.4 4 22.9 14.7% 48.9 423.4 12.2% 65.4 595.0 11.2% 95.0 826.0 10.6% 126.0 1,202,0 9.8% 204.0 1,788.0 9,8% 272.0 2,387,0 94% 568.0 3,505,0 9,9% 4,008,0 9,7% 4,761.0 9.7% 0.0% 3,193.0 10.0% 482.0 105.0 3,780 2,663 2,177 4 72 489 690 Yr End Jan. 31 Income Statement Net sales ($ mill) United States Europe Other international Gross profit Op expenses SGA SGA revenues R&D Special charges Total op expenses Operating income Not income % of net sales Net sales United States Europe Others Gross profit Op expenses Marketing & sales R&D Special charges Total op expenses Operating income Net income 215 67 310 139 102 9 52 714 5 31 1,406 1,316 944 2,069 2,046 1.460 2,955 2,263 1,666 1,789 1.246 2,844 2,122 3,544 2.645 4.254 3,043 51 (36) 149 2 72 100.0% 100.0% 100.0% 100.0% 100.0% 27% 0% 31.7% 100.0% 72% 28% 0% 22.3% 27% 2% 15.1% 27% 4% 21.2% 28% 6% 20.1% 26% 6% 21.5% 100.0% 69% 24% 7% 22.1% 100.0% 68% 26% 6% 22.5% 100.0% 71% 22% 7% 20.6% 100.0% 72% 20% 8% 20.2% 70.0% 21.0% 9.0% 17.7% 71.0% 19.0% 0.0% 17.9% 69.0% 21.0% 0.0% 18.2% 67.0% 22.0% 11.0% 18.3% 20.5% 3.7% 13.3% 2.1% 14.7% 1.7% 12.2% 1.9% 11.3% 1.8% 10.7% 1.6% 9.8% 1.6% 9.8% 1.5% 9.4% 2.3% 24.2% 7.5% 5.7% 15.4% 6.9% 5.0% 16,4% -1.4% 1.2% 14.1% 7.2% 4.3% 13.1% 7.1% 5.1% 12,3% 9.2% 6.8% 11,4% 10.7% 7.7% 11.3% 1.2% 8.0% 11.7% 9.0% 6.6% 10.0% 1.5% 0.3% 11.8% 8.4% 6,8% 5.7% 4,0% 8.0% 6.0% 8.6% 6.4% 8.6% 6.2% 10,350 16,200 Other Significant Dell Operating Statistics Employees Days supply of inv Avg. total rev/unit 24,400 36,500 40,000 34,600 39,100 46,000 55,200 6654334 2,3501 2.250 2.170 1,8301 1,7201 1.600 1,570 2,700 2,600 Balance Sheet Fin Perf Market Share EMC 1997 1998 1999 2000 2001 115 1237 903 251 320 1524 1486 233 53 349 3965 1726 923 2094 273 67 4910 528 2895 400 80 758 9571 2418 31 791 241 2778 3809 323 2608 391 65 550 7746 2721 1140 (375) 765 304 374 (139) 235 509 (167) 342 Yr. ending Jan 31 of that year Balance Sheet ($ million) Assets Cash and equivalents Other short term investments Accounts receivable Inventory Inventory turnover Other current asstes Total current assets Long term invesment Property, plant & equipment Accum. depreciation and amortization Property, plant & equipment (net) Goodwill / Intangibles Other long term assets Total Assets Asset turnover Liabilities Accounts payable Receivables/Payables Other current liabilities Total current liabilities Long term debt Other long term liabilities Total liabilities Shareholders' equity ROE Total Liabilities and Shareholders' Equity 5874 532 775 (252) 523 15 996 2993 2.6 14 4268 2.9 6877 2.7 11471 2.2 530 13435 2.4 4286 0.7 2257 6543 509 1040 1643 2397 0.9 0.9 0.9 618 1054 1298 1658 2697 3695 18 17 512 511 261 349 2187 2975 4556 806 1293 2321 65.9% 73.0% 62.9% 299342686877| 3538 0.7 1654 5192 508 463 6163 5308 31.4% 11471 761 7813 5622 38.7% 13435 Balance Sheet Fin Perf Market Share EMC Industry 1 1992 1993 1994 1995 1996 1997 1998 1999 2000 2001 2002 2003 2004 2005 31,168 35,404 41,444 49 205 890 648 242 2 2014 1,460 553 1.3 449.5 2.873 ,037 782 54.0 432. 8 3.4755 2.400 953 122.4 7 38 .296 3,474 1,478 344 1,067 7.759 5.279 2,004 476 1,666 12.327 8.531 2,956 840 2.722 18,243 12.420 4,675 1,149 4.106 25 266 17,879 5,590 1,796 5,198 31,888 22.871 6,399 2,618 6,443 282 2 5,5076,349 7,552 9,015 182.2 20.5% 33. 1 268. 0 13.3% 4 2.4 4 22.9 14.7% 48.9 423.4 12.2% 65.4 595.0 11.2% 95.0 826.0 10.6% 126.0 1,202,0 9.8% 204.0 1,788.0 9,8% 272.0 2,387,0 94% 568.0 3,505,0 9,9% 4,008,0 9,7% 4,761.0 9.7% 0.0% 3,193.0 10.0% 482.0 105.0 3,780 2,663 2,177 4 72 489 690 Yr End Jan. 31 Income Statement Net sales ($ mill) United States Europe Other international Gross profit Op expenses SGA SGA revenues R&D Special charges Total op expenses Operating income Not income % of net sales Net sales United States Europe Others Gross profit Op expenses Marketing & sales R&D Special charges Total op expenses Operating income Net income 215 67 310 139 102 9 52 714 5 31 1,406 1,316 944 2,069 2,046 1.460 2,955 2,263 1,666 1,789 1.246 2,844 2,122 3,544 2.645 4.254 3,043 51 (36) 149 2 72 100.0% 100.0% 100.0% 100.0% 100.0% 27% 0% 31.7% 100.0% 72% 28% 0% 22.3% 27% 2% 15.1% 27% 4% 21.2% 28% 6% 20.1% 26% 6% 21.5% 100.0% 69% 24% 7% 22.1% 100.0% 68% 26% 6% 22.5% 100.0% 71% 22% 7% 20.6% 100.0% 72% 20% 8% 20.2% 70.0% 21.0% 9.0% 17.7% 71.0% 19.0% 0.0% 17.9% 69.0% 21.0% 0.0% 18.2% 67.0% 22.0% 11.0% 18.3% 20.5% 3.7% 13.3% 2.1% 14.7% 1.7% 12.2% 1.9% 11.3% 1.8% 10.7% 1.6% 9.8% 1.6% 9.8% 1.5% 9.4% 2.3% 24.2% 7.5% 5.7% 15.4% 6.9% 5.0% 16,4% -1.4% 1.2% 14.1% 7.2% 4.3% 13.1% 7.1% 5.1% 12,3% 9.2% 6.8% 11,4% 10.7% 7.7% 11.3% 1.2% 8.0% 11.7% 9.0% 6.6% 10.0% 1.5% 0.3% 11.8% 8.4% 6,8% 5.7% 4,0% 8.0% 6.0% 8.6% 6.4% 8.6% 6.2% 10,350 16,200 Other Significant Dell Operating Statistics Employees Days supply of inv Avg. total rev/unit 24,400 36,500 40,000 34,600 39,100 46,000 55,200 6654334 2,3501 2.250 2.170 1,8301 1,7201 1.600 1,570 2,700 2,600
Step by Step Solution
There are 3 Steps involved in it

Get step-by-step solutions from verified subject matter experts